标签:阴影 使用 技术分享 end new orm 显示 情况 tle
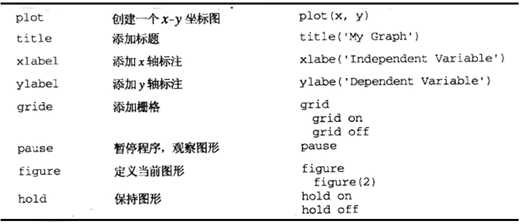
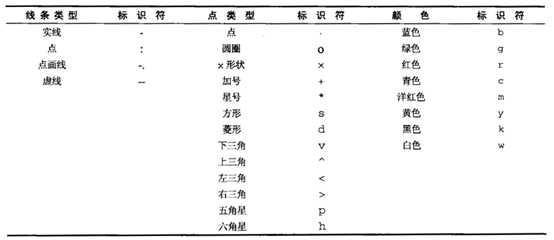

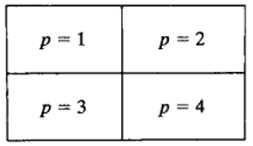
subplot(m,n,p) 把图形窗口分成m行n列,p对应第几个子图。
例如subplot(2,2,1)
例子:
x=0:pi/20:2*pi;

y1=sin(x);

y2=cos(x);

%第一个图形窗口

figure(1)

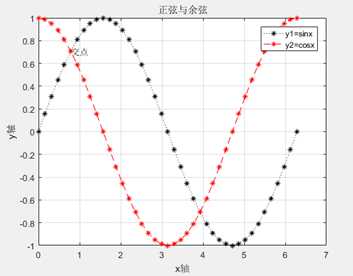
plot(x,y1,‘:*k‘,x,y2,‘--*r‘);   %参数依次为:线条类型,点类型,颜色

title(‘正弦与余弦‘)              %标题

xlabel(‘x轴‘)                   %标注x轴

ylabel(‘y轴‘)                   %标注y轴

legend(‘y1=sinx‘,‘y2=cosx‘)     %标注函数线

text(0.7853,0.7071,‘交点‘)      %在某个点添加文本框

grid on                         %添加栅格

%第二个图形窗口

figure(2)                       %重新打开一个空白图形窗口

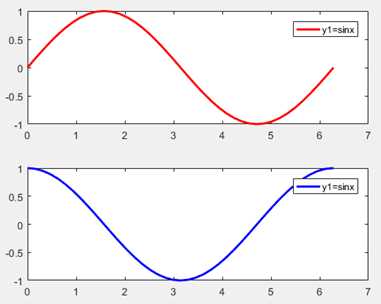
subplot(2,1,1)

axis([0,pi,0,1])                %限制x,y轴的最大最小值,[xmin,xmax,ymin,ymax]

plot(x,y1,‘r‘,‘LineWidth‘,2)    %使线条扩大一定倍数

legend(‘y1=sinx‘)

subplot(2,1,2)                  %把图形窗口分成2行1列

axis([0,pi,0,1])

plot(x,y2,‘b‘,‘LineWidth‘,2)

legend(‘y1=sinx‘)
运行结果:
(1)极坐标图: polar(theta,r)
(2)对数图

(3)条形图,柱状图和饼图

柱状图:显示数据的分布情况。
(4)双y轴图:适用于同个x区间,但y值相差较大的情况。
例子:
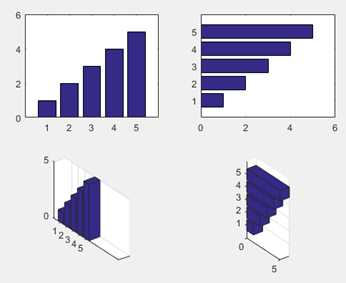
x=[1:5];

figure(1)

subplot(2,2,1)

bar(x);   %垂直条形图

subplot(2,2,2)

barh(x);  %水平条形图

subplot(2,2,3)

bar3(x);  %三维条形图

subplot(2,2,4)

bar3h(x); %三维水平条形图

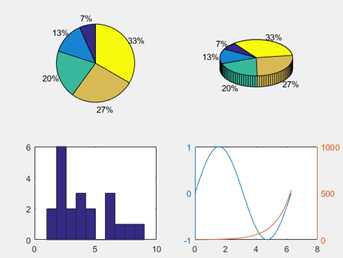
figure(2)

subplot(2,2,1)

pie(x);   %饼图

subplot(2,2,2)

pie3(x);  %三维饼图

subplot(2,2,3)

x1=[1 2 4 6 2 2 5 3 4 5 6 2 7 1 2  8 9 2 3 4 6];

hist(x1,10);  %柱状图,把数据从最大值到最小值等分成10份

subplot(2,2,4)

x2=0:pi/20:2*pi;

y1=sin(x2);

y2=exp(x2);

plotyy(x2,y1,x2,y2)  %双y图
运行结果:
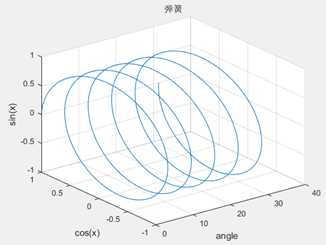
2.1 三维线图
x=linspace(0,10*pi,1000);  %0到10*pi中间插入1000个值

y=cos(x);

z=sin(x);

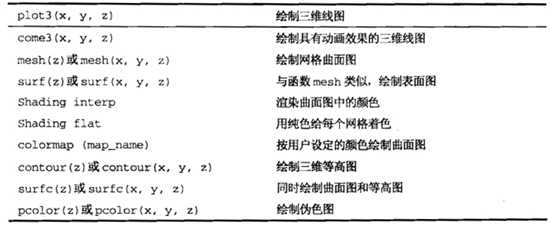
plot3(x,y,z)

grid

xlabel(‘angle‘);

ylabel(‘cos(x)‘);

zlabel(‘sin(x)‘);

title(‘弹簧‘)
运行结果:
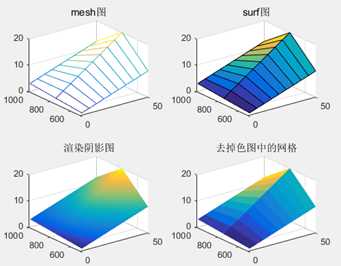
(1)mesh图 (无颜色):mesh(x,y,z)
(2)surf图 surf(x,y,z)
渲染颜色:shading interp 去掉颜色:shading flat
用户自定义颜色:colormap(gray) %输出灰色
其他颜色:

例子:
z=[1:10;2:2:20;3:12];

x=linspace(1,50,10);

y=[500,750,1000];

subplot(2,2,1);

mesh(x,y,z);     %mesh图

title(‘mesh图‘)

subplot(2,2,2);

surf(x,y,z);     %surf图

title(‘surf图‘)

subplot(2,2,3);

surf(x,y,z);

shading interp; %渲染阴影图

title(‘渲染阴影图‘)

subplot(2,2,4);

surf(x,y,z);

shading flat;   %去掉色图中的网格

title(‘去掉色图中的网格‘)
运行结果:
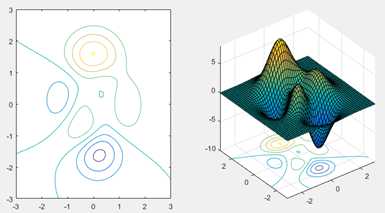
[x,y,z]=peaks;

subplot(1,2,1);

plot3(x,y,z);

contour(x,y,z)   %绘制三维等高图

 subplot(1,2,2);

surfc(x,y,z) %同时绘制等高图和曲面图
运行结果:
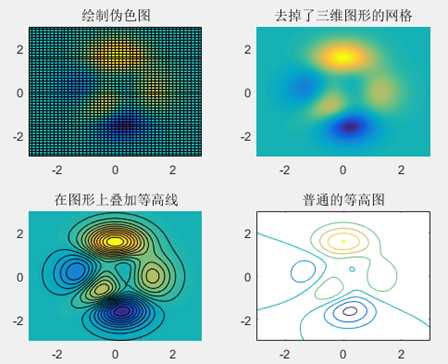
概念:用带栅格的二维阴影图代替等高图中的轮廓线。
[x,y,z]=peaks;

subplot(2,2,1);

pcolor(x,y,z);

title(‘绘制伪色图‘)


subplot(2,2,2);

pcolor(x,y,z);

shading interp;

title(‘去掉了三维图形的网格‘)


subplot(2,2,3);

pcolor(x,y,z);

shading interp;

hold on;

contour(x,y,z,20,‘k‘)

title(‘在图形上叠加等高线‘)


subplot(2,2,4);

contour(x,y,z)

title(‘普通的等高图‘)
运行结果:
标签:阴影 使用 技术分享 end new orm 显示 情况 tle
原文地址:http://www.cnblogs.com/youngsea/p/7505364.html