标签:技术 number cal ant plot 分享 geo class 分析

> pathway = read.table("data.tsv",header = T, sep="\t")
> library(ggplot2)
> p = ggplot(pathway,aes(Pvalue,Pathway))
> p=p + geom_point()
> p=p + geom_point(aes(size=Count))
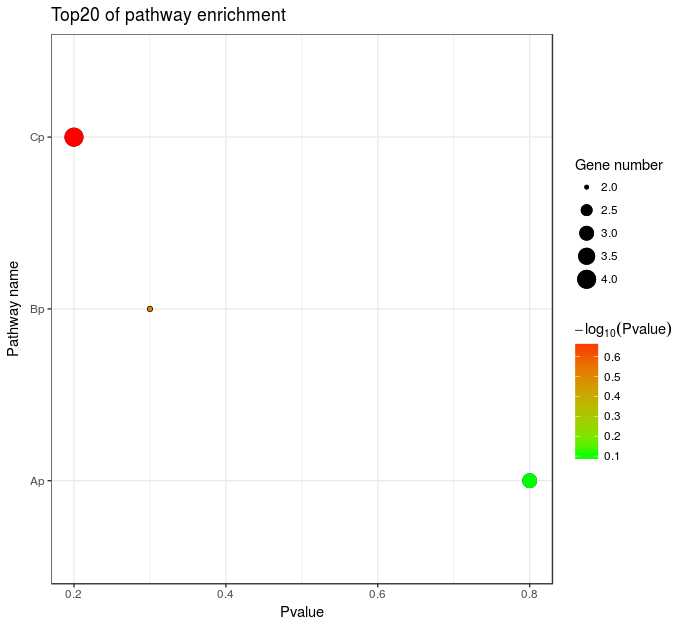
> pbubble = p+ geom_point(aes(size=Count,color=-1*log10(Pvalue)))
> pr = pbubble+scale_color_gradient(low="green",high = "red")
> pr = pr+labs(color=expression(-log[10](Pvalue)),size="Gene number",
+              x="Pvalue",y="Pathway name",title="Pathway enrichment")
> pr=pr + theme_bw()

标签:技术 number cal ant plot 分享 geo class 分析
原文地址:http://www.cnblogs.com/xiaojikuaipao/p/7543613.html