标签:cal 柱状图 地图 grid return sim rest 百分比 仪表
 1 option = {
 2     title: {
 3         x: ‘center‘,
 4         text: ‘ECharts例子个数统计‘,
 5         subtext: ‘Rainbow bar example‘,
 6         link: ‘http://echarts.baidu.com/doc/example.html‘
 7     },
 8     tooltip: {
 9         trigger: ‘item‘
10     },
11     toolbox: {
12         show: true,
13         feature: {
14             dataView: {show: true, readOnly: false},
15             restore: {show: true},
16             saveAsImage: {show: true}
17         }
18     },
19     calculable: true,
20     grid: {
21         borderWidth: 0,
22         y: 80,
23         y2: 60
24     },
25     xAxis: [
26         {
27             type: ‘category‘,
28             show: false,
29             data: [‘Line‘, ‘Bar‘, ‘Scatter‘, ‘K‘, ‘Pie‘, ‘Radar‘, ‘Chord‘, ‘Force‘, ‘Map‘, ‘Gauge‘, ‘Funnel‘]
30         }
31     ],
32     yAxis: [
33         {
34             type: ‘value‘,
35             show: false
36         }
37     ],
38     series: [
39         {
40             name: ‘ECharts例子个数统计‘,
41             type: ‘bar‘,
42             itemStyle: {
43                 normal: {
44                     color: function(params) {
45                         // build a color map as your need.
46                         var colorList = [
47                           ‘#C1232B‘,‘#B5C334‘,‘#FCCE10‘,‘#E87C25‘,‘#27727B‘,
48                            ‘#FE8463‘,‘#9BCA63‘,‘#FAD860‘,‘#F3A43B‘,‘#60C0DD‘,
49                            ‘#D7504B‘,‘#C6E579‘,‘#F4E001‘,‘#F0805A‘,‘#26C0C0‘
50                         ];
51                         return colorList[params.dataIndex]
52                     },
53                     label: {
54                         show: true,
55                         position: ‘top‘,
56                         formatter: ‘{b}\n{c}%‘    //这个是关键,找到你要显示的内容加上就行了
57                     }
58                 }
59             },
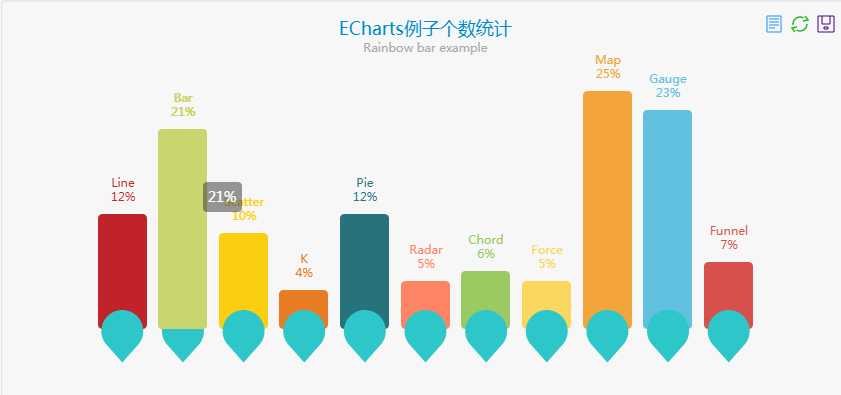
60             data: [12,21,10,4,12,5,6,5,25,23,7],
61             markPoint: {
62                 tooltip: {
63                     trigger: ‘item‘,
64                     backgroundColor: ‘rgba(0,0,0,0)‘,
65                     formatter: function(params){
66                         return ‘<img src="‘
67                                 + params.data.symbol.replace(‘image://‘, ‘‘)
68                                 + ‘"/>‘;
69                     }
70                 },
71                 data: [
72                     {xAxis:0, y: 350, name:‘Line‘, symbolSize:20, symbol: ‘image://../asset/ico/折线图.png‘},
73                     {xAxis:1, y: 350, name:‘Bar‘, symbolSize:20, symbol: ‘image://../asset/ico/柱状图.png‘},
74                     {xAxis:2, y: 350, name:‘Scatter‘, symbolSize:20, symbol: ‘image://../asset/ico/散点图.png‘},
75                     {xAxis:3, y: 350, name:‘K‘, symbolSize:20, symbol: ‘image://../asset/ico/K线图.png‘},
76                     {xAxis:4, y: 350, name:‘Pie‘, symbolSize:20, symbol: ‘image://../asset/ico/饼状图.png‘},
77                     {xAxis:5, y: 350, name:‘Radar‘, symbolSize:20, symbol: ‘image://../asset/ico/雷达图.png‘},
78                     {xAxis:6, y: 350, name:‘Chord‘, symbolSize:20, symbol: ‘image://../asset/ico/和弦图.png‘},
79                     {xAxis:7, y: 350, name:‘Force‘, symbolSize:20, symbol: ‘image://../asset/ico/力导向图.png‘},
80                     {xAxis:8, y: 350, name:‘Map‘, symbolSize:20, symbol: ‘image://../asset/ico/地图.png‘},
81                     {xAxis:9, y: 350, name:‘Gauge‘, symbolSize:20, symbol: ‘image://../asset/ico/仪表盘.png‘},
82                     {xAxis:10, y: 350, name:‘Funnel‘, symbolSize:20, symbol: ‘image://../asset/ico/漏斗图.png‘},
83                 ]
84             }
85         }
86     ]
87 };
88
结果如下:

附上官网链接:http://echarts.baidu.com/echarts2/doc/example/bar14.html
标签:cal 柱状图 地图 grid return sim rest 百分比 仪表
原文地址:http://www.cnblogs.com/nelsonlei/p/7729349.html