标签:9.png [1] 技术分享 dsp fprintf ber ann about cti
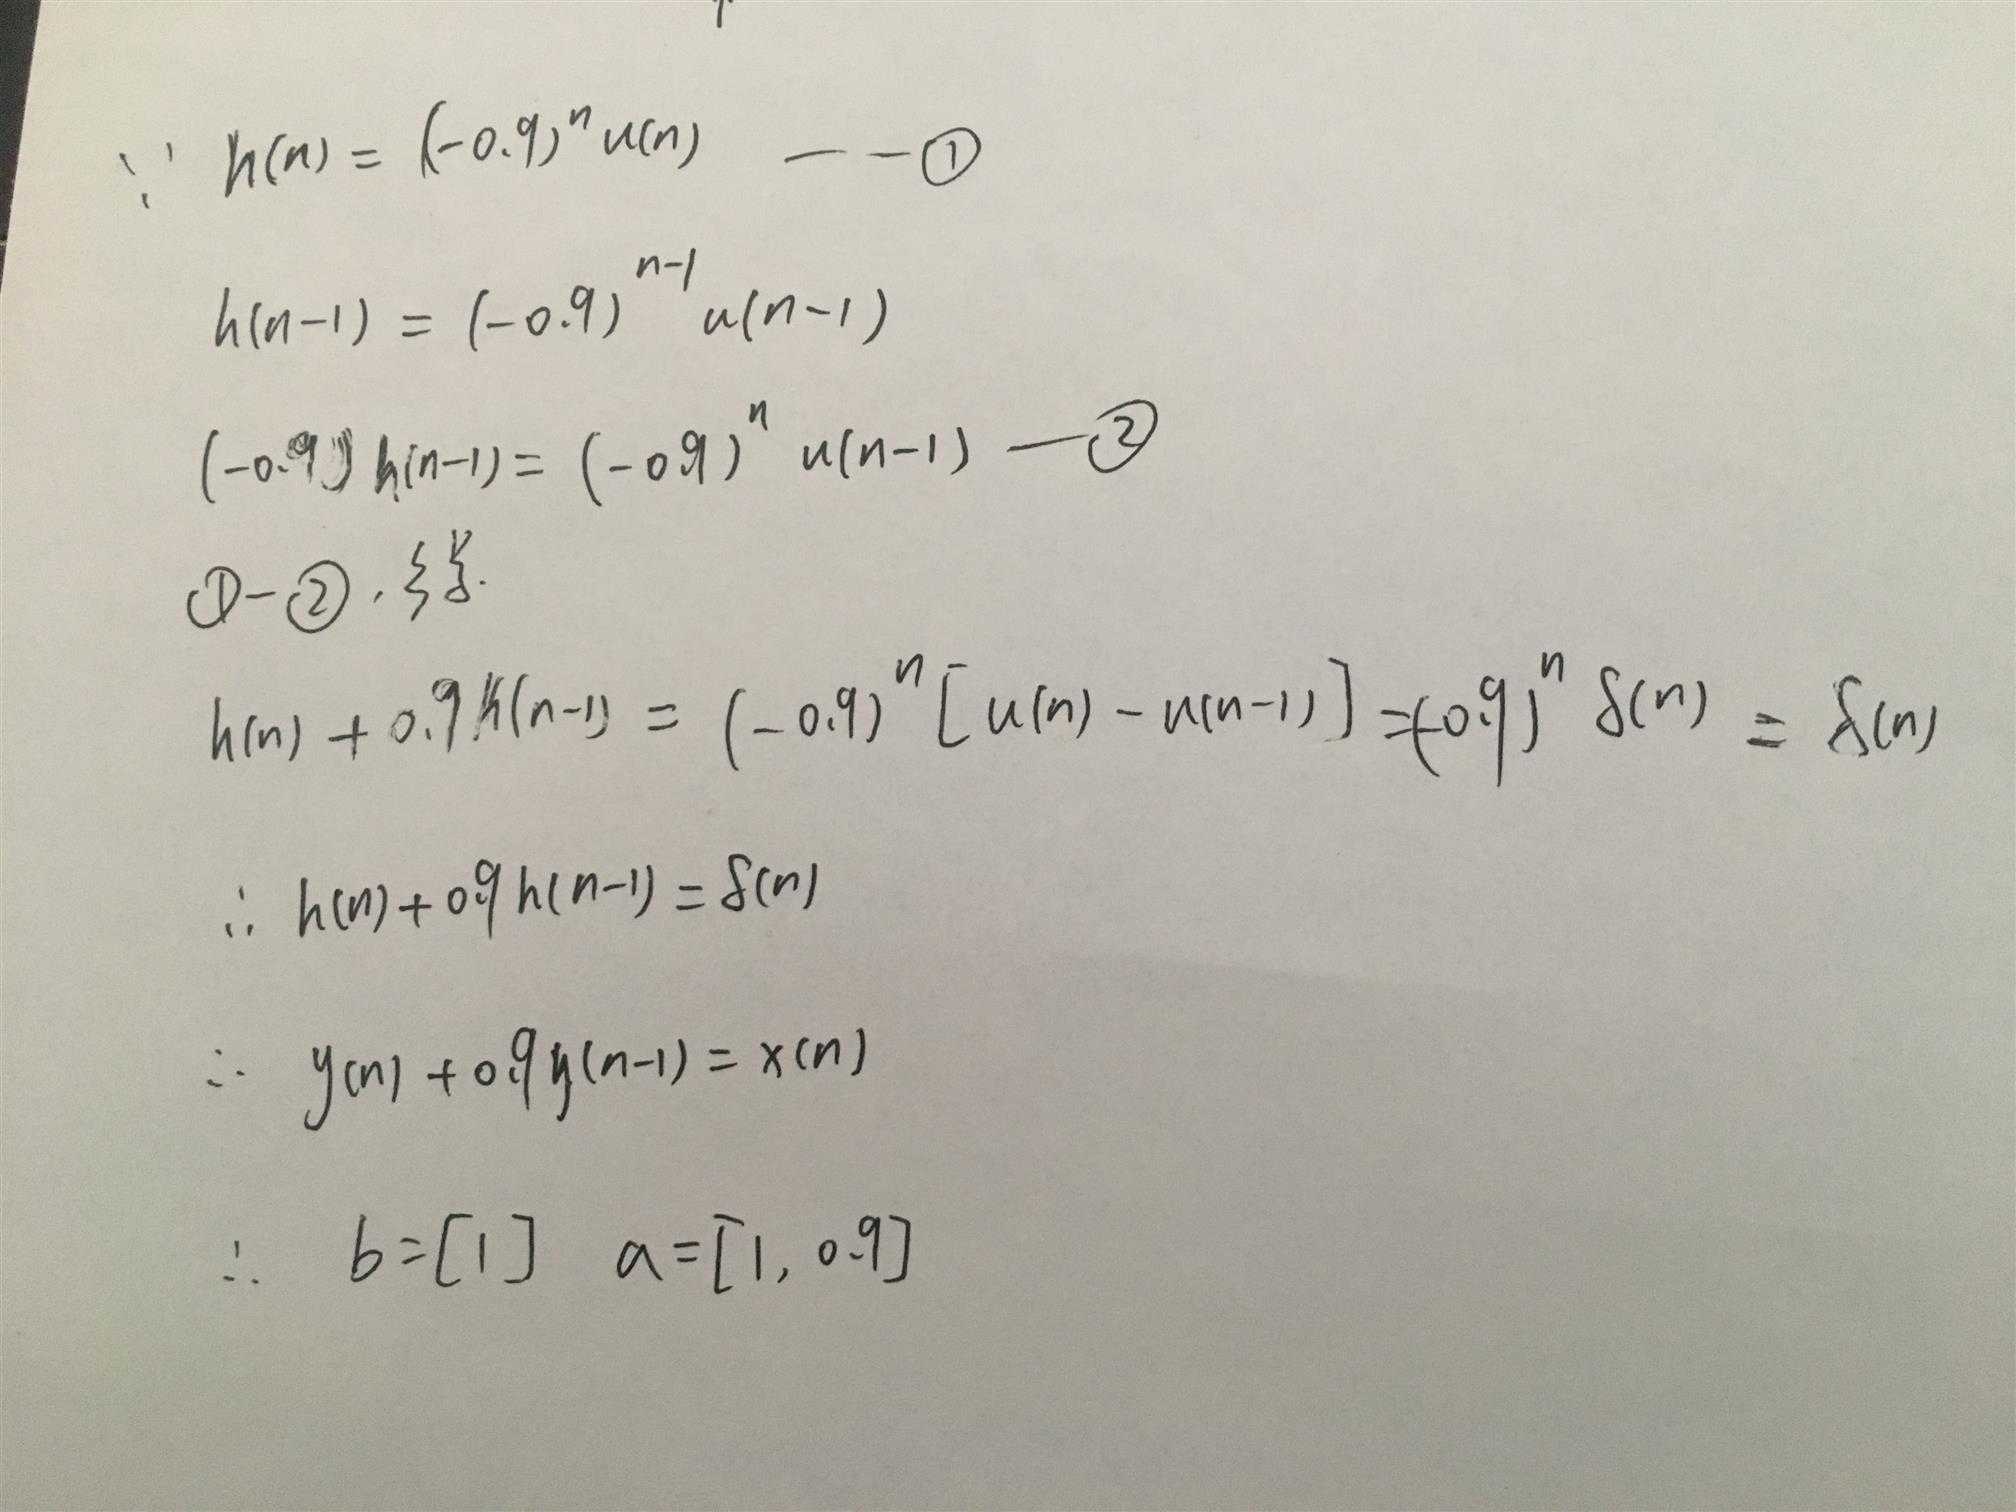
先由脉冲响应序列h(n)得到差分方程系数,过程如下:
代码:
%% ------------------------------------------------------------------------
%%            Output Info about this m-file
fprintf(‘\n***********************************************************\n‘);
fprintf(‘        <DSP using MATLAB> Problem 2.16 \n\n‘);

banner();
%% ------------------------------------------------------------------------


%% ------------------------------------------------------
%%              sequence of 51 samples
%% ------------------------------------------------------
nx1 = [-1:49]; x1 = (0.8 .^ nx1) .* stepseq(0, -1, 49);
nh1 = [-1:49]; h1 = ( (-0.9).^nh1 ) .* stepseq(0, -1, 49);

[y1, ny1] = conv_m(x1, nx1, h1, nh1);

figure(‘NumberTitle‘, ‘off‘, ‘Name‘, ‘Problem 2.16‘)
set(gcf,‘Color‘,[1,1,1])                  % 改变坐标外围背景颜色

subplot(3,1,1); stem(nx1, x1); title(‘x1 sequence‘);
xlabel(‘n‘); ylabel(‘x(n)‘) ;
grid on
subplot(3,1,2); stem(nh1, h1); title(‘h1 sequence‘);
xlabel(‘n‘); ylabel(‘h1(n)‘);
grid on;
subplot(3,1,3); stem(ny1, y1); title(‘y1=x1*h1 sequence‘);
xlabel(‘n‘); ylabel(‘y1(n)‘);
grid on;


%% -----------------------------------------------------
%%         Trancate to 26 samples
%% -----------------------------------------------------
nx2 = [-1:24]; x2 = (0.8 .^ nx2) .* stepseq(0, -1, 24);
nh2 = [-1:24]; h2 = ( (-0.9).^nh2 ) .* stepseq(0, -1, 24);

[y2, ny2] = conv_m(x2, nx2, h2, nh2);

figure(‘NumberTitle‘, ‘off‘, ‘Name‘, ‘Problem 2.16‘)
set(gcf,‘Color‘,[1,1,1])                  % 改变坐标外围背景颜色

subplot(3,1,1); stem(nx2, x2); title(‘x2 sequence‘);
xlabel(‘n‘); ylabel(‘x2(n)‘) ;
grid on
subplot(3,1,2); stem(nh2, h2); title(‘h2 sequence‘);
xlabel(‘n‘); ylabel(‘h2(n)‘);
grid on;
subplot(3,1,3); stem(ny2, y2); title(‘y2=x2*h2 sequence‘);
xlabel(‘n‘); ylabel(‘y2(n)‘);
grid on;


%% ----------------------------------------------------------
%%            filter function
%% ----------------------------------------------------------
b = [1]; a = [1, 0.9];

y3 = filter(b, a, x1);


figure(‘NumberTitle‘, ‘off‘, ‘Name‘, ‘Problem 2.16‘)
set(gcf,‘Color‘,[1,1,1])                  % 改变坐标外围背景颜色

%subplot(3,1,3);
stem(nx1, y3); title(‘y3 sequence‘);
xlabel(‘n‘); ylabel(‘y3(n)‘);
grid on;
运行结果:
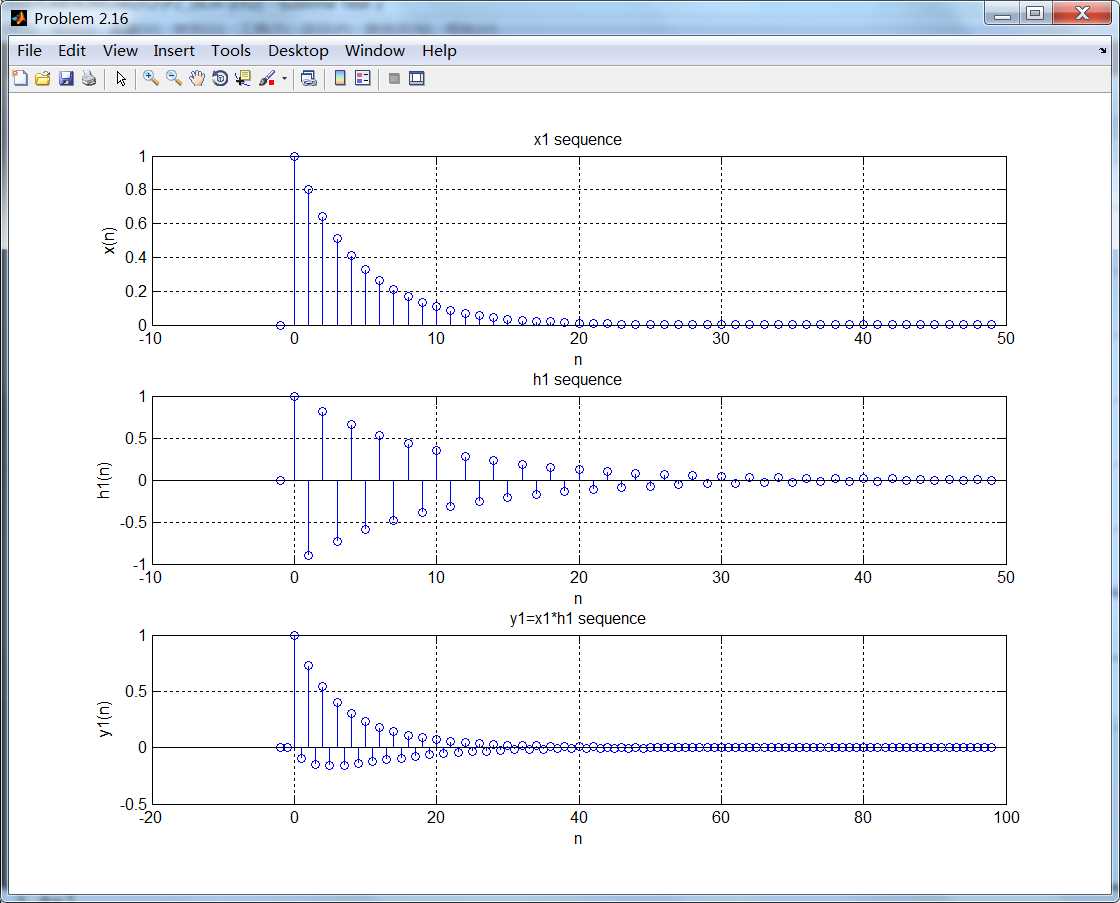
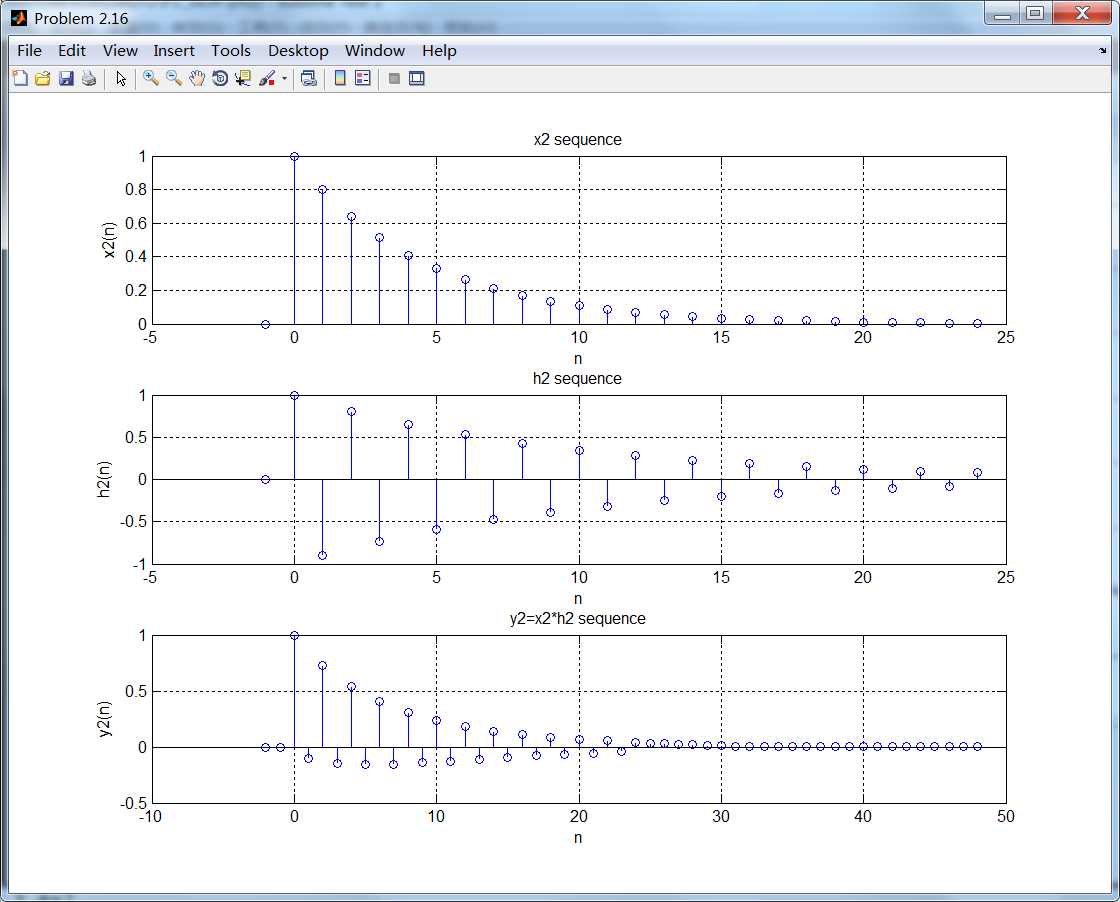
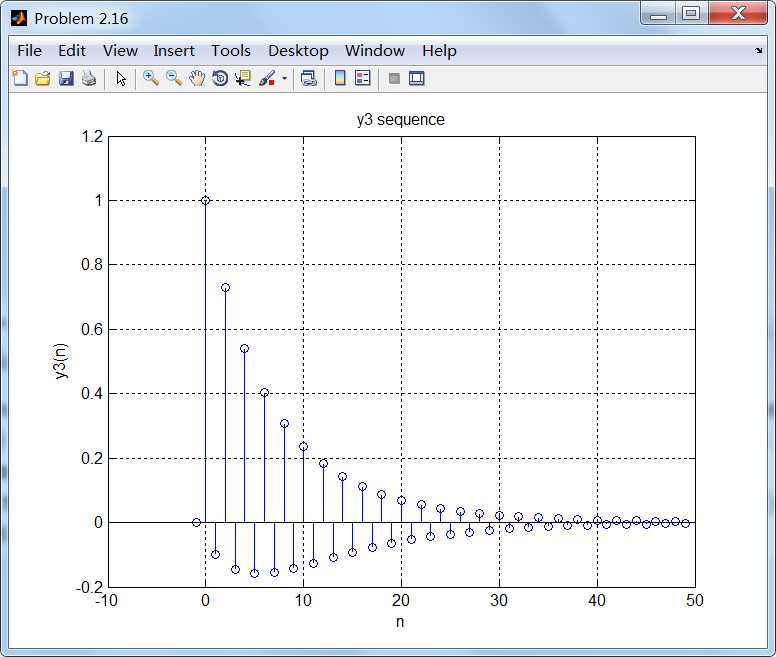
《DSP using MATLAB》Problem 2.16
标签:9.png [1] 技术分享 dsp fprintf ber ann about cti
原文地址:http://www.cnblogs.com/ky027wh-sx/p/8007428.html