标签:com blog gen 数据 技术 images 笔记 list pre
import matplotlib.plot as plt
fig = plt.figure()
ax1 = fig.add_subplot(4,3,1)
ax2 = fig.add_subplot(4,3,6)
plt.show()
建立一个包含4行3列个子图的figure,add_subplot()可以指定放置位置,具体关系如下:
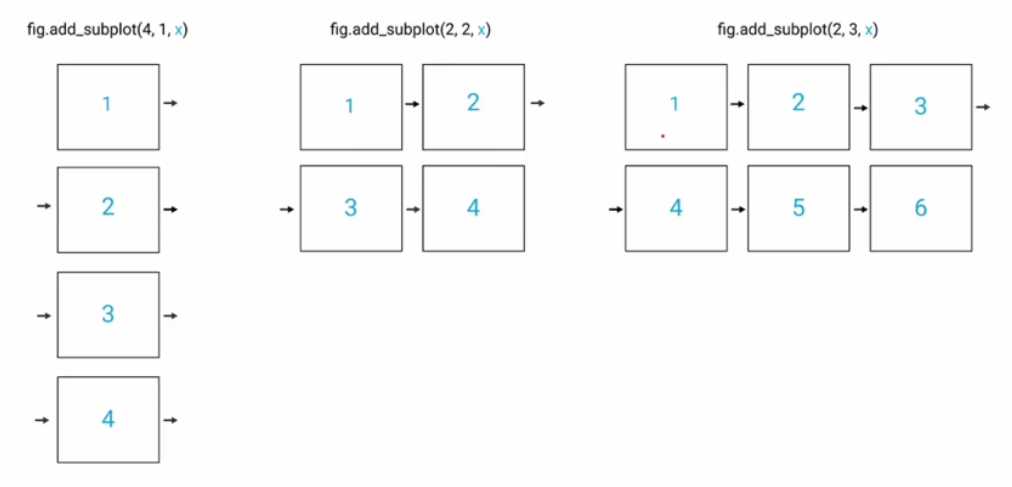
fig = plt.figure(figsize=(10,6))
figure()中可包含参数figsize=(10,6),10表示figure对象的横向长度,6表示纵向长度。
ax1.plot(x_list,y_list,c=color)#数据与线条颜色
ax1.legend(loc=‘best‘)#添加图例
标签:com blog gen 数据 技术 images 笔记 list pre
原文地址:http://www.cnblogs.com/imageSet/p/8012751.html