Matplotlib Python 画图教程 (莫烦Python)_演讲?公开课_科技_bilibili_哔哩哔哩 https://www.bilibili.com/video/av16378354/?from=search&seid=16336534570780842214
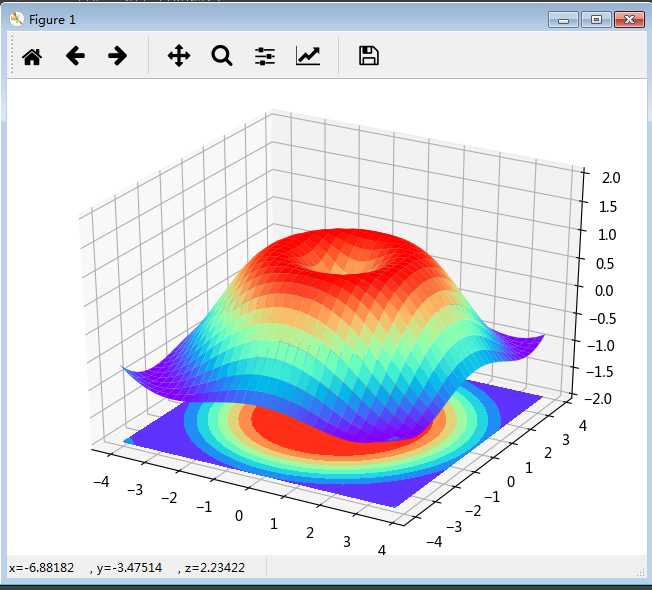
"""画3D图""" import numpy as np import matplotlib.pyplot as plt from mpl_toolkits.mplot3d import Axes3D fig = plt.figure() ax = Axes3D(fig) # X,Y value X = np.arange(-4, 4, 0.25) Y = np.arange(-4, 4, 0.25) X, Y = np.meshgrid(X, Y) R = np.sqrt(X**2 + Y**2) # Z value Z = np.sin(R) # 画3D,restride为3D图上每个行宽,cstride为列宽 ax.plot_surface(X, Y, Z, rstride=1, cstride=1, cmap=plt.get_cmap(‘rainbow‘)) ax.contourf(X, Y, Z, zdir=‘z‘, offset=-2, cmap=‘rainbow‘) # zdir为等高线图与Z轴垂直 ax.set_zlim(-2, 2) plt.show()
"""subplot另外三种分格方法"""
import matplotlib.pyplot as plt
import matplotlib.gridspec as gridspec


##### Method 1:subplot2grid
plt.figure()
ax1 = plt.subplot2grid((3, 3), (0, 0), rowspan=1, colspan=3)  # 起点0行0列,跨度1行3列
ax1.plot([1, 2], [1, 2])
ax1.set_title(‘ax1 title‘)  # 有ax用set
ax2 = plt.subplot2grid((3, 3), (1, 0), rowspan=1, colspan=2)
ax3 = plt.subplot2grid((3, 3), (1, 2), rowspan=2, colspan=1)
ax4 = plt.subplot2grid((3, 3), (2, 0))
ax5 = plt.subplot2grid((3, 3), (2, 1))

# ##### Method 2:gridspec
plt.figure()
gs = gridspec.GridSpec(3, 3)  # 返回一个对象3行3列的对象
ax1 = plt.subplot(gs[0, :])  # 行列
ax2 = plt.subplot(gs[1, :2])
ax3 = plt.subplot(gs[1:, 2])
ax4 = plt.subplot(gs[2, 0])
ax5 = plt.subplot(gs[2, 1])


##### Method3:easy to define structure
# 返回值是figure和所有的axes.((ax11, ax12), (ax21, ax22))为格式
f, ((ax11, ax12), (ax21, ax22)) = plt.subplots(2, 2, sharex=True, sharey=True)
ax11.scatter([1, 2], [1, 2])


plt.tight_layout()  # 紧凑显示图片,居中显示
plt.show()
这是非常实用的,因为可以轻松地对axes数组进行索引,就好像是一个二维数组一样,例如,axes[0, 1]。你还可以通过sharex和sharey指定subplot应该具有相同的X轴或Y轴。在比较相同范围的数据时,这也是非常实用的,否则,matplotlib会自动缩放各图表的界限。

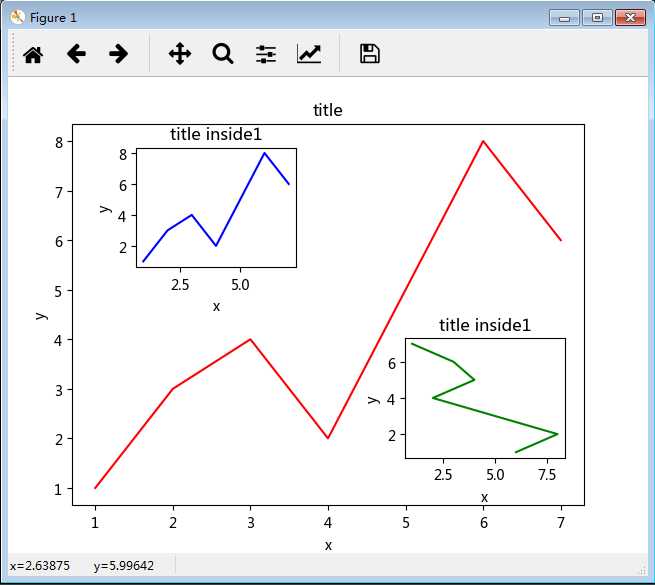
"""图中图"""
import matplotlib.pyplot as plt


fig = plt.figure()
x = [1, 2, 3, 4, 5, 6, 7]
y = [1, 3, 4, 2, 5, 8, 6]

left, bottom, widht, height = 0.1, 0.1, 0.8, 0.8  # 按在figure上的比例
ax1 = fig.add_axes([left, bottom, widht, height])
ax1.plot(x, y, ‘r‘)
ax1.set_xlabel(‘x‘)
ax1.set_ylabel(‘y‘)
ax1.set_title(‘title‘)
# inside axes1
left, bottom, widht, height = 0.2, 0.6, 0.25, 0.25
ax1 = fig.add_axes([left, bottom, widht, height])
ax1.plot(x, y, ‘b‘)
ax1.set_xlabel(‘x‘)
ax1.set_ylabel(‘y‘)
ax1.set_title(‘title inside1‘)
# inside axes2
plt.axes([0.62, 0.2, 0.25, 0.25])
plt.plot(y[::-1], x, ‘g‘)  # 默认跟着plt.axes
plt.xlabel(‘x‘)
plt.ylabel(‘y‘)
plt.title(‘title inside1‘)

plt.show()
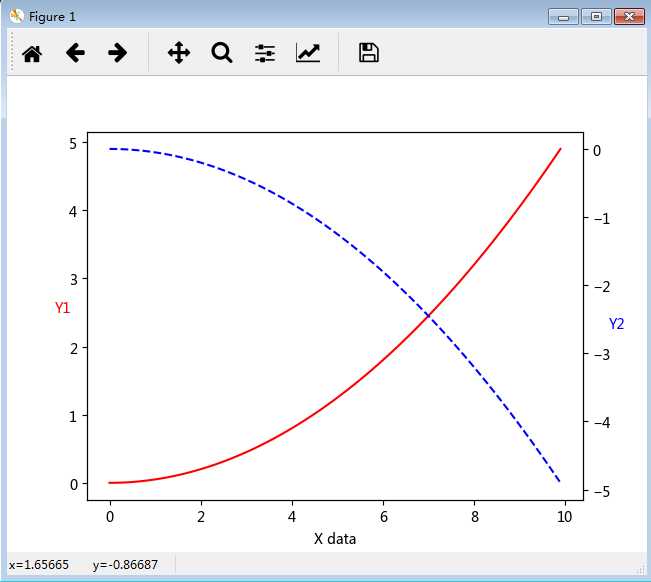
"""次坐标轴"""
import numpy as np
import matplotlib.pyplot as plt


x = np.arange(0, 10, 0.1)
y1 = 0.05*x**2
y2 = -1*y1

fig, ax1 = plt.subplots()
ax2 = ax1.twinx()  # Create a twin Axes sharing the xaxis 共用x轴
ax1.plot(x, y1, ‘r-‘)
ax2.plot(x, y2, ‘b--‘)

ax1.set_xlabel(‘X data‘)
ax1.set_ylabel(‘Y1‘, color=‘r‘, rotation=‘horizontal‘)
ax2.set_ylabel(‘Y2‘, color=‘b‘, rotation=‘horizontal‘)

plt.show()
"""动画"""
import numpy as np
import matplotlib.pyplot as plt
from matplotlib import animation

fig, ax = plt.subplots()
x = np.arange(0, 2*np.pi, 0.01)
line, = ax.plot(x, np.sin(x))


def animate(i):
    line.set_ydata(np.sin(x+i/10))
    return line,


def init():
    line.set_ydata(np.sin(x))
    return line,


ani = animation.FuncAnimation(fig=fig, func=animate, frames=100, init_func=init, interval=20, blit=True)
plt.show()
科学网—[转载]利用Python进行数据分析——绘图和可视化(八)(1) - 郭大龙的博文 http://blog.sciencenet.cn/blog-251664-800766.html
调整subplot周围的间距
默认情况下,matplotlib会在subplot外围留下一定的边距,并在subplot之间留下一定的间距。间距跟图像的高度和宽度有关,因此,如果你调整了图像的大小(不管是编程还是手工),间距也会自动调整。利用Figure的subplots_adjust方法可以轻而易举地修改间距,此外,它也是个顶级函数:
-
In [15]: subplots_adjust(left=None, bottom=None, right=None, top=None, wspace=None, hspace=None)
wspace和hspace用于控制宽度和高度的百分比,可以用作subplot之间的间距。下面是一个简单的例子,我们将间距收缩到了0:

不难看出,其中的轴标签重叠了。matplotlib不会检查标签是否重叠,所以对于这种情况,你只能自己设定刻度位置和刻度标签。
在线型图中,非实际数据点默认是按线性方式插值的。可以通过drawstyle选项修改:
-
In [18]: plt.plot(randn(30).cumsum(), ‘ko--‘)
-
Out[18]: [<matplotlib.lines.Line2D at 0xb86924c>]
-
-
In [19]: data = randn(30).cumsum()
-
-
In [20]: plt.plot(data, ‘k--‘, label=‘Default‘)
-
Out[20]: [<matplotlib.lines.Line2D at 0xba62c8c>]
-
-
In [21]: plt.plot(data, ‘k--‘, drawstyle=‘steps-post‘, label=‘steps-post‘)
-
Out[21]: [<matplotlib.lines.Line2D at 0xba758ac>]
-
-
In [22]: plt.legend(loc=‘best‘)
-
Out[22]: <matplotlib.legend.Legend at 0xba75bcc>
