#输出散点图
def f():
    datingDataMat,datingLabels = file2matrix("datingTestSet3.txt")

    fig = plt.figure()
    # ax = fig.add_subplot(199,projection=‘polar‘)
    # ax = fig.add_subplot(111,projection=‘hammer‘)
    # ax = fig.add_subplot(111,projection=‘lambert‘)
    # ax = fig.add_subplot(111,projection=‘mollweide‘)
    # ax = fig.add_subplot(111,projection=‘aitoff‘)
    # ax = fig.add_subplot(111,projection=‘rectilinear‘)
    # ax = fig.add_subplot(111,projection=‘rectilinear‘)

    #此处的add_subplot参数的意思是把画布分为3行4列,画在从左到右从上到下的第2个格里
    ax = fig.add_subplot(3,4,2) #fig.add_subplot(342)也可以,但是这样无法表示两位数

    ax.scatter(datingDataMat[:,1],datingDataMat[:,2])

    # ax1 = fig.add_subplot(221)
    # ax1.plot(datingDataMat[:,1],datingDataMat[:,2])
    plt.show()
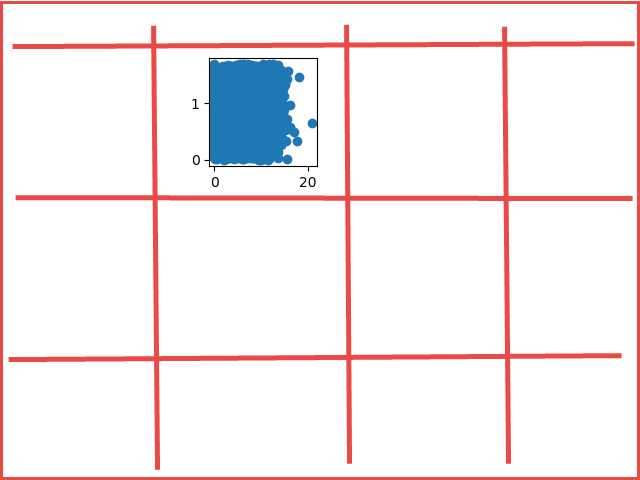
其中fig.add_subplot(3,4,2)的效果图如下(红框是我加的):

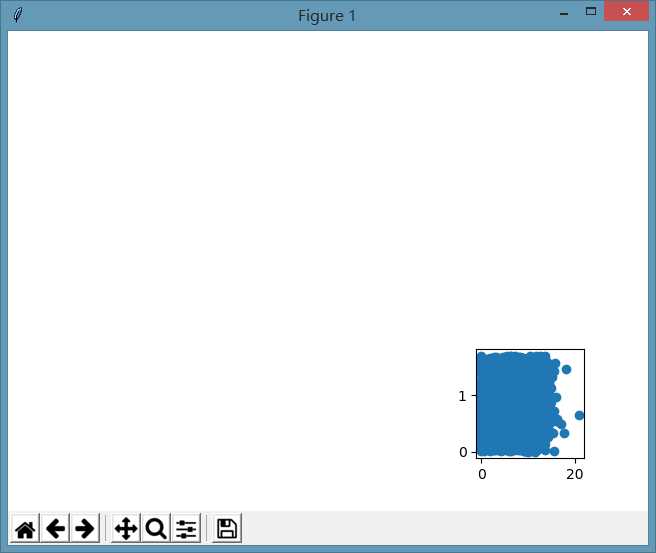
所以fig.add_subplot(3,4,12)的效果就是:

所以,第三个参数不能超过前两个的乘积,如果用fig.add_subplot(a,b,c)来表示的话,ab>=c,否则会报错。
对于fig.add_subplot(3,4,12)这个函数,官方网站的解释似乎有点问题,链接https://matplotlib.org/api/_as_gen/matplotlib.figure.Figure.html?highlight=add_subplot#matplotlib.figure.Figure.add_subplot
查询add_subplot(*args, **kwargs),得到如下解释:
*args
Either a 3-digit integer or three separate integers describing the position of the subplot. If the three integers are I, J, and K, the subplot is the Ith plot on a grid with J rows and K columns.
意思是,三个参数分别为I, J, K,表示J行K列,那I是什么?没有提及。
倒是下面的See also所指向的matplotlib.pyplot.subplot给出了正确的解释。
subplot(nrows, ncols, index, **kwargs)
In the current figure, create and return anAxes, at position index of a (virtual) grid of nrows by ncols axes. Indexes go from 1 tonrows *ncols, incrementing in row-major order.
If nrows, ncols and index are all less than 10, they can also be given as a single, concatenated, three-digit number.
For example, subplot(2, 3, 3) and subplot(233) both create an Axes at the top right corner of the current figure, occupying half of the figure height and a third of the figure width.
