网络带宽的单位bps,b表示的bit,一个Byte=8bit。一般常说的10M带宽,10Mbps=10/8=1.25MBps(Byte)
查看机器上网卡速度
windows
打开"网络和共享中心"->选择网络,查看网络连接状态。如下图所示:
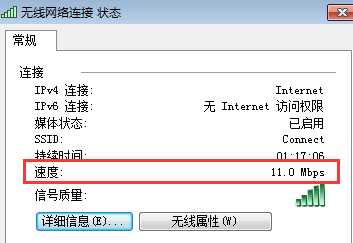
11Mbps
linux
使用查询及设置网卡参数的命令ethtool(http://man.linuxde.net/ethtool)查看,如使用ethtool eth1
# ethtool eth1
   Settings for eth1:
        Supported ports: [ TP ]
        Supported link modes:   10baseT/Half 10baseT/Full
                                100baseT/Half 100baseT/Full
                                1000baseT/Full
        Supports auto-negotiation: Yes
        Advertised link modes: 10baseT/Half 10baseT/Full
                                100baseT/Half 100baseT/Full
                                1000baseT/Full
        Advertised auto-negotiation: Yes
        Speed: 1000Mb/s
        Duplex: Full
        Port: Twisted Pair
        PHYAD: 0
        Transceiver: internal
        Auto-negotiation: on
        Supports Wake-on: umbg
        Wake-on: d
        Link detected: yes
操作完毕后,输出信息中Speed:这一项就指示了网卡的速度。
ifconfig的输出中有两项,分别是:
RX==receive,接收,从开启到现在接收封包的情况,是下行流量。
TX==Transmit,发送,从开启到现在发送封包的情况,是上行流量。
[root@test etc]# ifconfig eth1
eth1      Link encap:Ethernet  HWaddr 00:26:B9:58:19:88
          inet addr:192.168.0.46  Bcast:192.168.0.255  Mask:255.255.255.0
          UP BROADCAST RUNNING MULTICAST  MTU:1500  Metric:1
          RX packets:6049782538 errors:0 dropped:2373 overruns:0 frame:0
          TX packets:7415059121 errors:0 dropped:0 overruns:0 carrier:0
          collisions:0 txqueuelen:1000
          RX bytes:2611876455455 (2.3 TiB)  TX bytes:6028598337794 (5.4 TiB)
          Interrupt:114 Memory:d8000000-d8012800
RX和TX输出的值使有的单位参数是bytes,而利用该命令,我们也可以配置脚本进行流量检测。大名鼎鼎的nagios就有一个插件check_traffic,通过ifconfig的输出的RX、TX值通过之间的差,再除去中间间隔的时间算出流量大小的。该插件的下载页为:https://github.com/cloved/check_traffic/downloads 。
现摘录其中部分关于度量值转换的部分如下:
#to K
uIn=`echo "$ctbpsIn / 1024" | bc`
uOut=`echo "$ctbpsOut / 1024" | bc`
#to M
if [ "$isM" = "True" ]; then
    uIn=`echo "scale=$Scale; $uIn / 1024" | bc`
    uOut=`echo "scale=$Scale; $uOut / 1024" | bc`
fi
#to B
if [ "$isB" = "True" ]; then
    uIn=`echo "scale=$Scale; $uIn / 8" | bc`
    uOut=`echo "scale=$Scale; $uOut / 8" | bc`
检查网络情况
可以在系统不繁忙或者临时下线前检测客户端和server或者proxy 的带宽:
1)使用 iperf -s 命令将 Iperf 启动为 server 模式:
iperf –s
————————————————————
Server listening on TCP port 5001
TCP window size: 8.00 KByte (default)
————————————————————
2)启动客户端,向IP为10.230.48.65的主机发出TCP测试,并每2秒返回一次测试结果,以Mbytes/sec为单位显示测试结果:
iperf -c 10.230.48.65 -f M -i 2
ping命令
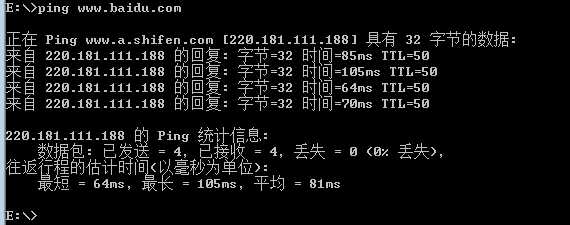
上边Ping www.a.shifen.com [220.181.111.188],这里的地址是指域名对应的服务器地址。
如hosts文件里,配置 220.181.111.188 www.a.shifen.com
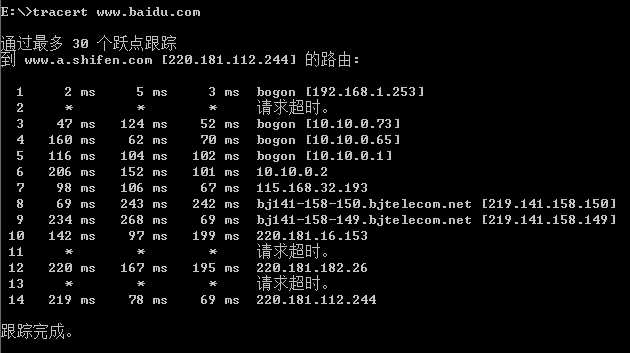
tracert