安装
wget https://github.com/prometheus/alertmanager/releases/download/v0.13.0/alertmanager-0.13.0.linux-amd64.tar.gz
tar -axvf alertmanager-0.13.0.linux-amd64.tar.gz
配置AlertManager
AlertManager安装目录下有默认的simple.yml文件,可以创建新的配置文件,在启动时指定即可。
配置文件如下:
global:
  smtp_smarthost: ‘smtp.163.com:25‘
  smtp_from: ‘jugglee@163.com‘
  smtp_auth_username: ‘jugglee@163.com‘
  smtp_auth_password: ‘admin123‘
  smtp_require_tls: false

templates:
  - ‘/alertmanager/template/*.tmpl‘

route:
  group_by: [‘alertname‘, ‘cluster‘, ‘service‘]
  group_wait: 30s
  group_interval: 5m
  repeat_interval: 10m
  receiver: default-receiver

receivers:
- name: ‘default-receiver‘
  email_configs:
  - to: ‘whiiip@163.com‘
    html: ‘{{ template "alert.html" . }}‘
    headers: { Subject: "[WARN] 报警邮件test" }
smtp_smarthost是用于发送邮件的邮箱的SMTP服务器地址+端口
smtp_auth_password是发送邮箱的授权码而不是登录密码
smtp_require_tls不设置的话默认为true,当为true时会有starttls错误,可以用其他办法解决。为了简单这里直接设置为false
templates指出邮件的模板路径
receivers下html指出邮件内容模板名,这里模板名为“alert.html”,在模板路径中的某个文件中定义
headers为邮件标题
配置Prometheus报警规则
配置rule.yml
groups:
- name: test-rule
  rules:
  - alert: clients
    expr: redis_connected_clients > 1
    for: 1m
    labels:
      severity: warning
    annotations:
      summary: "{{$labels.instance}}: Too many clients detected"
      description: "{{$labels.instance}}: Client num is above 80% (current value is: {{ $value }}"
在prometheus.yml中指定rule.yml的路径
# my global config
global:
  scrape_interval:     15s # Set the scrape interval to every 15 seconds. Default is every 1 minute.
  evaluation_interval: 15s # Evaluate rules every 15 seconds. The default is every 1 minute.
  # scrape_timeout is set to the global default (10s).

# Alertmanager configuration
alerting:
  alertmanagers:
  - static_configs:
    - targets: ["localhost:9093"]

# Load rules once and periodically evaluate them according to the global ‘evaluation_interval‘.
rule_files:
   - /rule.yml
  # - "second_rules.yml"

# A scrape configuration containing exactly one endpoint to scrape:
# Here it‘s Prometheus itself.
scrape_configs:
  # The job name is added as a label `job=<job_name>` to any timeseries scraped from this config.
  - job_name: ‘prometheus‘

    # metrics_path defaults to ‘/metrics‘
    # scheme defaults to ‘http‘.

    static_configs:
      - targets: [‘localhost:9090‘]

  - job_name: redis_exporter

    static_configs:
      - targets: [‘localhost:9122‘]
编写邮件模板
文件后缀为tmpl
{{ define "alert.html" }}
<table>
    <tr><td>报警名</td><td>开始时间</td></tr>
    {{ range $i, $alert := .Alerts }}
        <tr><td>{{ index $alert.Labels "alertname" }}</td><td>{{ $alert.StartsAt }}</td></tr>
    {{ end }}
</table>
{{ end }}
启动各个组件
启动AlertManager
cd /home/admin/alertmanager-0.13.0.linux-amd64
./alertmanager --config.file=alert.yml
启动Prometheus
cd /home/admin/prometheus-2.1.0.linux-amd64
./prometheus --config.file=prometheus.yml
启动exporter
cd /prometheus_exporters
./node_exporter &
./redis_exporter redis//localhost:6379 & -web.listenaddress 0.0.0.0:9122
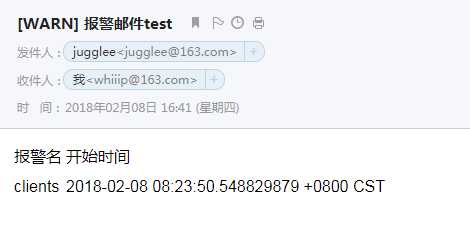
效果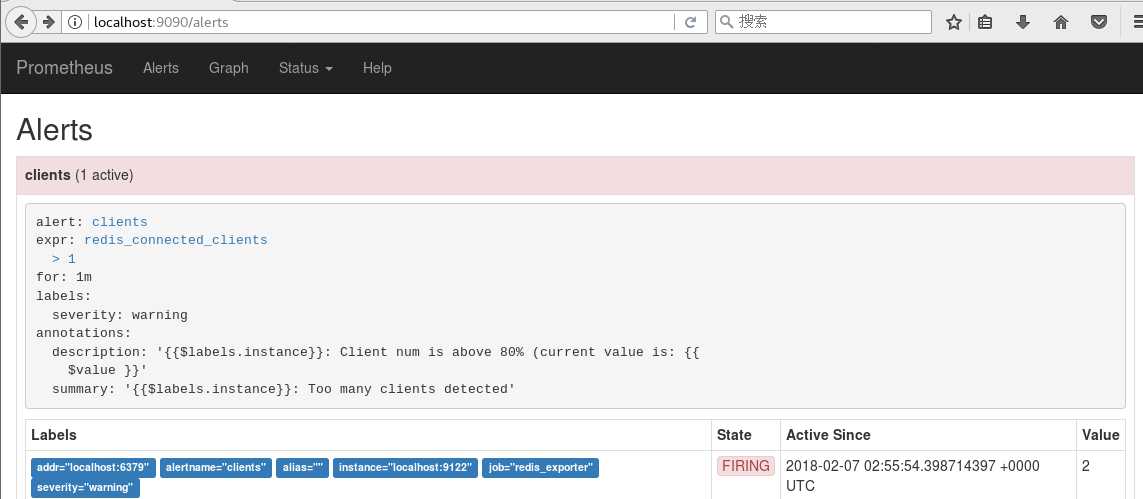
收到的邮件