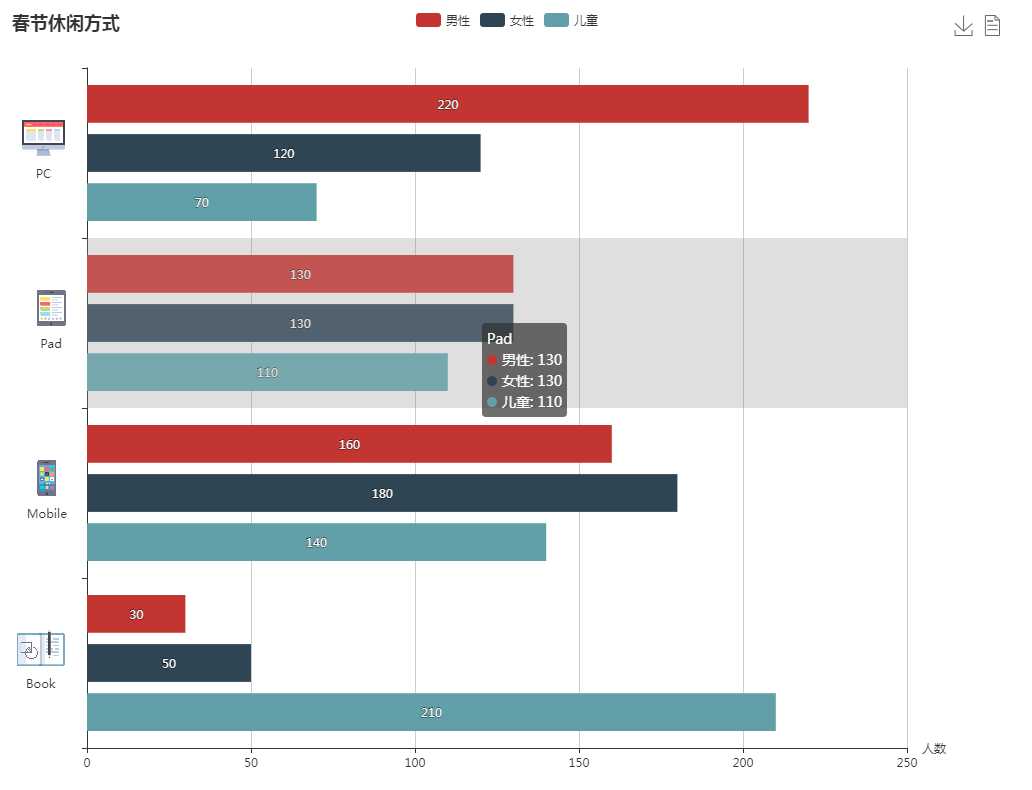
主要过了一遍ECharts的教程,顺带写了个Demo 数据都是假的

        var pasttime={
            ‘PC‘:‘./img/pc.png‘,
            ‘Pad‘:‘./img/pad.png‘,
            ‘Mobile‘:‘./img/mobile.png‘,
            ‘Book‘:‘./img/book.png‘

        };

        var seriesLabel = {
            normal: {
                show: true,
                textBorderColor: ‘#000‘,
                textBorderWidth: 1
            }
        }

        var myChart=echarts.init(document.getElementById(‘myIconChart‘));
        var option={
            //标题
            title:{
                text:‘春节休闲方式‘
            },
            //提示框
            tooltip:{
                trigger:‘axis‘,                //axis:坐标轴|item:数据项|none:无
                axisPointer:{                   //坐标轴指示器配置项
                    type:‘shadow‘               //line:直线|shadow:阴影|cross:十字准星
                }
            },
            //图例
            legend:{
                data:[‘男性‘,‘女性‘,‘儿童‘]
            },
            //
            grid:{
                left:80
            },
            //工具栏
            toolbox:{
                show:true,
                itemSize:20,
                feature:{
                    saveAsImage:{},
                    dataView:{readOnly:true}
                }
            },
            //X坐标轴
            xAxis:{
                type:‘value‘,                   //value:数值|category:类目轴|time:时间轴|log:对数轴
                name:‘人数‘,
                axisLabel:{
                    formatter:‘{value}‘
                }
            },
            yAxis:{
                type:‘category‘,
                inverse:true,                    //反向坐标
                data:[‘PC‘,‘Pad‘,‘Mobile‘,‘Book‘],
                axisLabel:{
                    formatter:function(value){
                        return ‘{‘+value+‘|}\n{value|‘+value+‘}‘;
                    },
                    margin:20,
                    rich:{
                        value:{
                            lineHeight:30,
                            align:‘center‘
                        },
                        PC:{
                            height:40,
                            align:‘center‘,
                            backgroundColor:{
                                image:pasttime.PC
                            }
                        },
                        Pad:{
                            height:40,
                            align:‘center‘,
                            backgroundColor:{
                                image:pasttime.Pad
                            }
                        },
                        Mobile:{
                            height:40,
                            align:‘center‘,
                            backgroundColor:{
                                image:pasttime.Mobile
                            }
                        },
                        Book:{
                            height:40,
                            align:‘center‘,
                            backgroundColor:{
                                image:pasttime.Book
                            }
                        }
                    }
                }
            },
            //系列列表。每个系列通过 type 决定自己的图表类型
            series:[
                {
                    name:‘男性‘,
                    type:‘bar‘,
                    data:[220,130,160,30],
                    label: seriesLabel
                },
                {
                    name:‘女性‘,
                    type:‘bar‘,
                    data:[120,130,180,50],
                    label: seriesLabel
                },
                {
                    name:‘儿童‘,
                    type:‘bar‘,
                    data:[70,110,140,210],
                    label: seriesLabel
                }
            ]
        }

        myChart.setOption(option);
