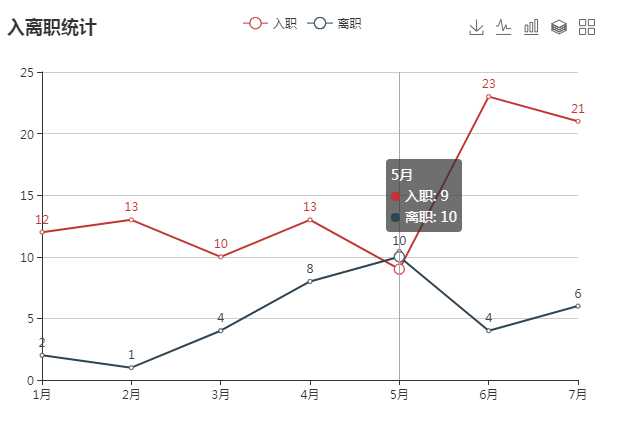
效果图:

设置数据:
option1: {
          title: {
            text: ‘入离职统计‘
          },
          tooltip: {//提示框组件,default:‘item‘,还有axis,none
            trigger: ‘axis‘
          },
          legend: {
            data: [‘入职‘, ‘离职‘]//显示条
          },
          grid: {
            left: ‘3%‘,
            right: ‘4%‘,
            bottom: ‘3%‘,
            containLabel: true
          },
          toolbox: {
            feature: {
              saveAsImage: {},保存为png图片
              magicType: {//切换图表显示类型
                type: [‘line‘, ‘bar‘, ‘stack‘, ‘tiled‘]
              }
            }
          },
          xAxis: {
            type: ‘category‘,
            boundaryGap: false,
            data: [‘1月‘, ‘2月‘, ‘3月‘, ‘4月‘, ‘5月‘, ‘6月‘, ‘7月‘]
          },
          yAxis: {
            type: ‘value‘
          },
          series: [
            {
              itemStyle: {normal: {label: {show: true}}},
              name: ‘入职‘,
              type: ‘line‘,//设置图表类型
              // stack: ‘总量‘,
              data: [12, 13, 10, 13, 9, 23, 21]
            },
            {
              itemStyle: {normal: {label: {show: true}}},
              name: ‘离职‘,
              type: ‘line‘,
              // stack: ‘总量‘,
              data: [2, 1, 4, 8, 10, 4, 6]
            }
          ]
        }
