过年后的第一篇Blog,说实话年后的自己好慵懒,一直处于半睡半醒状态 ̄□ ̄||。年后工作上用了好多新东西,像Spring Boot,Swagger,Jenkins,Maven,突然发现以前后台做的工作好像越来越简单了(不过这些东西还都只是接触个皮毛,一出问题就要百度半天^_^)。不过既然我的SSM框架已经搭起来了,而我毕设重点是前端的工作,所以新工具的运用还是推后再说吧O(∩_∩)O哈哈~
一、使用SSM框架实现第一个echarts的例子
1.首先先生成一张存放数据的表并给数据赋值(用MySQL存放数据)
create table t_product
(
prod1 int ,
prod2 int ,
prod3 int ,
prod4 int
);
2.写一个Product类,并书写dao层和service层的代码,再在web中写一个controller类
package com.briup.web.controller;

import java.util.List;

import org.springframework.beans.factory.annotation.Autowired;
import org.springframework.stereotype.Controller;
import org.springframework.web.bind.annotation.RequestMapping;
import org.springframework.web.bind.annotation.RequestMethod;
import org.springframework.web.bind.annotation.ResponseBody;

import com.briup.bean.Product;
import com.briup.service.IProductService;

@Controller
@RequestMapping("/product")
public class ProductController {
    @Autowired
    private IProductService productService;

    @RequestMapping(value="/getAll",method=RequestMethod.POST,produces="application/json")
    @ResponseBody
    public List<Product> getAll(){
        List<Product> list = null;
        try {
            list = productService.findAllProduct();
            //System.out.println(list);
            /*for (int i = 0; i < list.size(); i++) {
                System.out.println(list.get(i).getProd1());
            }  */
        } catch (Exception e) {
            e.printStackTrace();
        }
        return list;
    }
}
然后引入echarts.js,使用ajax接收后台传来的数据
<%@ page language="java" contentType="text/html; charset=UTF-8"
    pageEncoding="UTF-8"%>
<%
String path = request.getContextPath();
String basePath = request.getScheme()+"://"+request.getServerName()+":"+request.getServerPort()+path+"/";
%>
<!DOCTYPE html PUBLIC "-//W3C//DTD HTML 4.01 Transitional//EN" "http://www.w3.org/TR/html4/loose.dtd">
<html>
<head>
<base href="<%=basePath%>" />
<meta http-equiv="Content-Type" content="text/html; charset=ISO-8859-1">
<title>ECharts Test</title>
<script type="text/javascript" src="js/echarts.js"></script>
<script type="text/javascript" src="js/jquery-1.8.3.min.js"></script>
</head>
<body>
<div id="main" style="width:600px;height:400px;"></div>
<input type="button" value="显示信息">
<script type="text/javascript">
var prod1;
var prod2;
var prod3;
var prod4;
$(function(){
    $("input:button").on("click",function(){
        $.ajax({
           type: "POST",
           url: "product/getAll",
           dataType: "json",
           success: function(data){
               /* $.each(data,function(){
                    prod1 = this.prod1;
                    prod2 = this.prod2;
                    prod3 = this.prod3;
                    prod4 = this.prod4;

               }); */
                prod1 = data[0].prod1;
                prod2 = data[0].prod2;
                prod3 = data[0].prod3;
                prod4 = data[0].prod4;
               //基于准备好的dom,初始化echarts实例
                var myChart = echarts.init(document.getElementById(‘main‘),‘light‘);
                //指定图标的配置和数据
                var option = {
                        //设置全局调色板
                        //color: [‘#c23531‘,‘#2f4554‘, ‘#61a0a8‘, ‘#d48265‘, ‘#91c7ae‘,‘#749f83‘,  ‘#ca8622‘, ‘#bda29a‘,‘#6e7074‘, ‘#546570‘, ‘#c4ccd3‘],
                        title : {text:‘My First ECharts‘},
                        tooltip:{},
                        legend:{
                            data:[‘销量‘]
                        },
                        xAxis:{data:["白菜","黄瓜","萝卜","青椒"]},
                        yAxis:{},
                        series:[{name:‘销量‘,type:‘bar‘,
                            //此系列自己的调色板
                            //color: [‘#c23531‘,‘#2f4554‘, ‘#61a0a8‘, ‘#d48265‘, ‘#91c7ae‘,‘#749f83‘,  ‘#ca8622‘, ‘#bda29a‘,‘#6e7074‘, ‘#546570‘, ‘#c4ccd3‘],
                            data:[prod1,prod2,prod3,prod4]}]
                };
                //使用刚指定的配置项和数据显示图标
                myChart.setOption(option);
           }
        });
    });
});

</script>
</body>
</html>
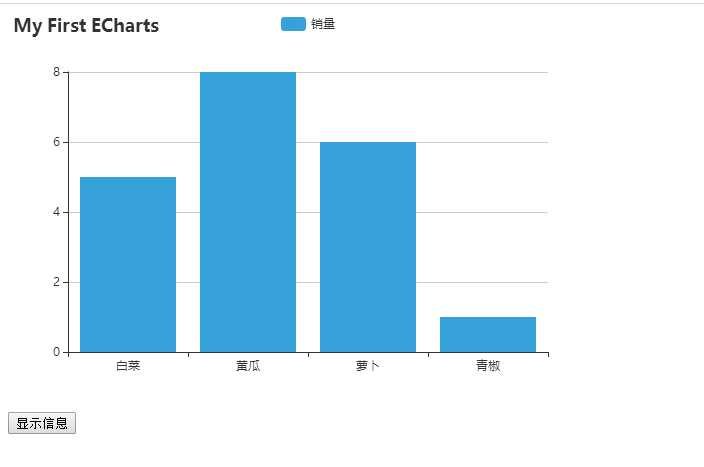
好了,打开服务器,在浏览器中输入地址http://localhost:8989/SSM/echarts,点击显示信息,便可加载出直方图。

二、一个调用百度开发者工具的例子
小例子:地图标记
1.申请百度地图开发API
2.异步加载数据,获取经纬度
3.绘图,在地图上做标记
第一步:
初始化文件
引入bootstrap,jQuery和echarts
第二步:
准备好html内容
准备好输入框和echarts容器
第三步:
申请百度开发者秘钥
baPR00ppe070ar5zGQTVRLzqtxOpcKdN(地理编码服务详见http://lbsyun.baidu.com/index.php?title=webapi/guide/webservice-geocoding)
准备好输入框和echarts容器
研究geocoder接口使用
绑定事件,用户单击可以跨域调百度接口,获取经纬度信息。
<!DOCTYPE html>
<html lang="en">
<head>
  <meta charset="UTF-8">
  <title>Document</title>
  <link rel="stylesheet" href="../bootstrap.min.css">
  <style>
    body{
      padding-top:80px
    }
    #search-btn{
      margin-top: 20px;
    }
  </style>
</head>
<body>

<div class="container">
  <div class="row">
    <div class="col-md-3 col-md-offset-3">
      <form class="form-horizontal">
        <input id="place-input" type="text" class="form-control" value="趵突泉" placeholder="请输入地址">
        <button type="button" id="search-btn" class="btn btn-success">
          查询
        </button>
      </form>

    </div>
    <div class="col-md-6">
      <div id="main" style="height:500px;"></div>
    </div>
  </div>
</div>
<script src=‘../jquery.min.js‘></script>
<script src=‘../echarts.min.js‘></script>
<script src=‘../china.js‘></script>
<script>
// 百度地图的开发者秘钥
var token = ‘fHrNQj6DHTjZtfTvfqbsuvTzKc5V9SBl‘
var url = ‘http://api.map.baidu.com/geocoder/v2/?output=json&ak=‘ + token + ‘&address=‘
var ePlaceInput = $(‘#place-input‘)
var eSearchBtn = $(‘#search-btn‘)
var myChart = echarts.init(document.getElementById(‘main‘))
var chartData = []
eSearchBtn.click(function() {
  var place = ePlaceInput.val()
  if (place) {
    $.getJSON(url + place + ‘&callback=?‘, function(res) {
      var loc
      if (res.status === 0) {
        loc = res.result.location
        chartData.push({
          name: name,
          value: [loc.lng, loc.lat]
        })
        drawMap(place)
      }else{
        alert(‘百度没有找到地址信息‘)
      }
    })
  }
})

function drawMap(name) {

  var option = {
    backgroundColor: ‘#404a59‘,
    title: {
      text: ‘2018要去的地方‘,
      left: ‘center‘,
      textStyle: {
        color: ‘#fff‘
      }
    },
    tooltip: {
      trigger: ‘item‘
    },
    toolbox: {
        show: true,
        feature: {
            saveAsImage: {
                show: true
            }
        }
    },
    geo: {
      map: ‘china‘,
      label: {
        emphasis: {
          show: false
        }
      },
      roam: true,
      itemStyle: {
        normal: {
          areaColor: ‘#323c48‘,
          borderColor: ‘#111‘
        },
        emphasis: {
          areaColor: ‘#2a333d‘
        }
      }
    },
    series: [{
      name: ‘地址‘,
      type: ‘scatter‘,
      coordinateSystem: ‘geo‘,
      data: chartData,
      symbolSize: function(val) {
        return 10;
      },
    }]
  }
  myChart.setOption(option)
}

</script>
</body>
</html>
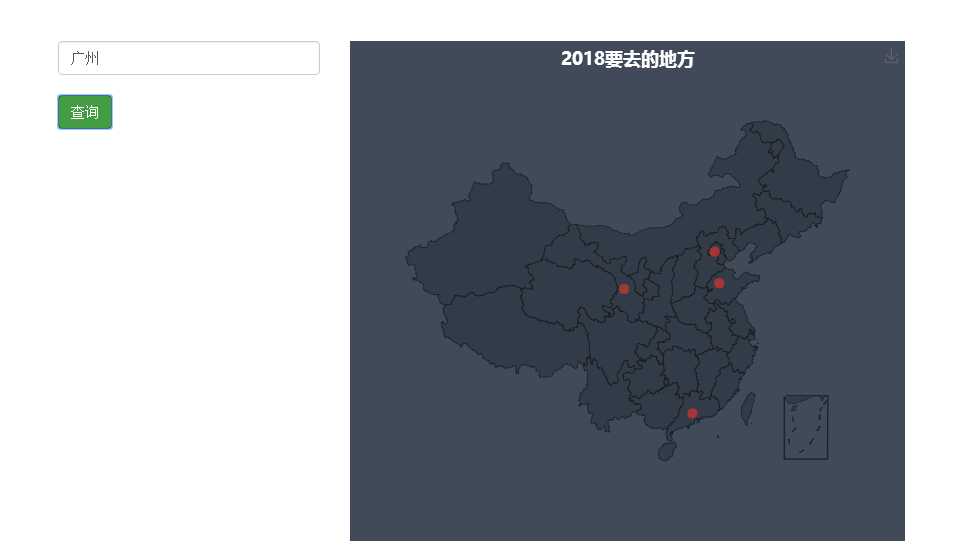
效果如下(搜索一个地方,就会显示一个地点):

