LightningChart最新版v.8.3全新发布,主要介绍以下五个新功能及使用教程。
1. 网格模型,三角鼠标追踪
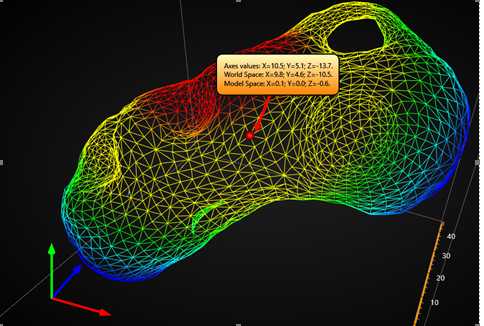
Tracing MeshModels with mouse. Traced result is shown in an Annotation.
使用MouseTriangleTraced 事件. 鼠标将会显示离相机最近的三角形
事件参数信息如下:
- IntersectionPointAxisValues: intersection point of triangle face, in axes values
- ModelSpaceTriangleCoordinates: array of 3 triangle corners (vertices) the mouse is hitting, in 3D model space coordinates
- WorldSpaceTriangleCoordinates: array of 3 triangle corners (vertices) the mouse is hitting, in 3D world space coordinates.
- NearestCoordinateIndex: Index of nearest coordinate index of traced triangle, value of 0…2. Use the index to extract the coordinate from ModelSpaceTriangleCoordinates or WorldSpaceTriangleCoordinates array.
2. SeriesEventMarkers新样式,Y轴投影
除了常用样式外,SeriesEventMarker支持两个特殊的Symbol.Shape样式设置,实现垂直线与Y轴刻度投影,如图中的HollowYAxis 和 HollowYAxisActive。它们具有1像素宽的垂直线,并且从Y轴 MajorTicks 和MinorTicks 中选取位置。如需调整刻度长度,请编辑YAxis.MajorDivTickStyle.LineLength 和 YAxis.MinorDivTickStyle.LineLength 属性。
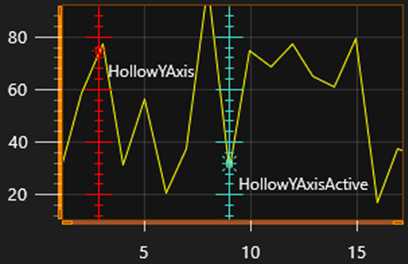
特殊事件标记样式HollowYAxis 和HollowYAxisActive,便于制作每个系列数据游标。
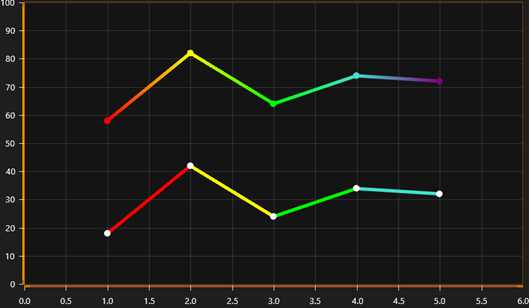
3. XY线图颜色和样式事件改进
在事件参数中添加数据点指数:
- HasDataPointIndices: Only applicable in FreeformPointLineSeries.
- DataPointIndices: Data point indices that were included in the coordinates and colors arrays. Note: chart will skip subsequent points in line construction, if their X and Y values or coordinates are equal. Using DataPointIndices info, you can e.g. pick a color for line point, from data point’s PointColor field or external color array.
4. 极地视图PointLineSeries中新添线样式及颜色事件中设有坐标和颜色操作事件CustomLinePointColoringAndShaping。它包含与XY图相似的数据点指数 (请参考第3小节).
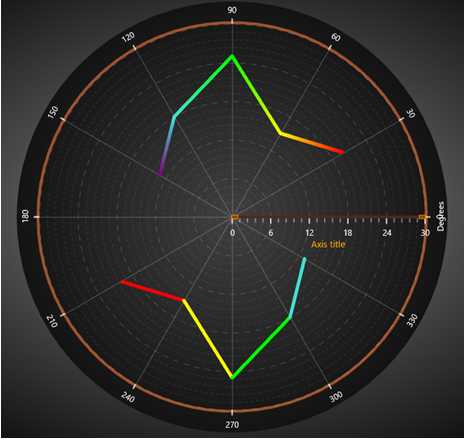
CustomLinePointColoringAndShaping event used to manipulate colors and coordinates of line.
5. 极坐标图轴增强
- 轴可以通过幅度,角度或两者来反转。
反转角度比例,设置AngularReversed = True.反转幅度比例,设置AmplitudeReversed = True.
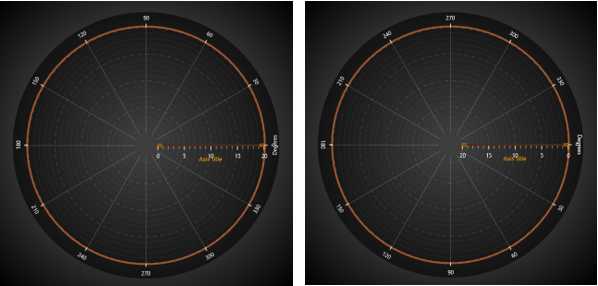
左边的比例没变,右边 AngularReversed = True and AmplitudeReversed = True.
- 相比极地图一般方位,给与不同角度的幅度比例
支持 AmplitudeAxisAngle转换幅度轴位置。幅度比例角度可以设置为精准的角度(AmpitudeAxisAngleType = Absolute), 或 (AmpitudeAxisAngleType = Relative).
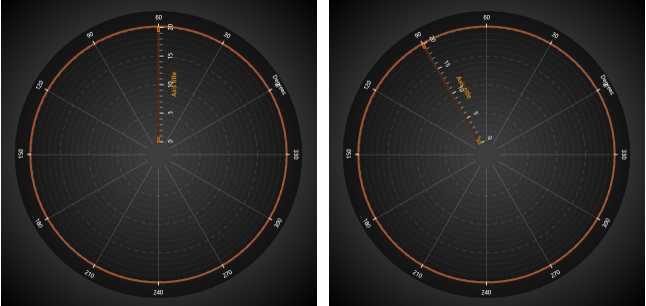
AngleOrigin = 30. AmplitudeAxisAngle = 90. On the left, AmplitudeAxisAngleType = Absolute. On the right, AmplitudeAxisAngleType = Relative: Overall the amplitude scale rotates 120 degrees in this case.
- 角度分区设置
默认情况下,图表尽量包含可能多的角度分割。控制角度分区,请设置AngularAxisAutoDivSpacing to False. 图表将会计算AngularAxisMajorDivCount分割区域数。如果图表空间太小而无法渲染所有分区和标签,则会使用可以容纳的分区数量。