标签:交互式 line ons cto 技术 ges ann kraken 3.1
第一步是添加 DevExtreme charting JavaScript文件到网站上,惊喜的发现DevExtreme居然有一个CDN(内容分发网络),提供了我需要的JavaScript文件。
|
1
|
<script type="text/javascript" src="http://cdn3.devexpress.com/jslib/13.1.5/js/dx.chartjs.js"></script> |
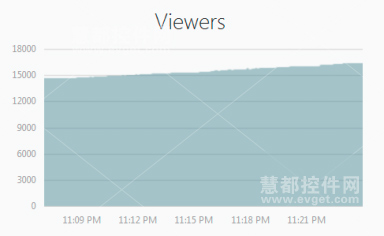
$("#gamesChartContainer").dxPieChart({ dataSource: [ { game: "Test game 1", viewers: 50, channels: 1, image: "test-game-1.jpg" }, { game: "Test game 1", viewers: 50, channels: 1, image: "test-game-1.jpg" } ], series: [ { argumentField: "game", valueField: "viewers", label: { visible: true, connector: { visible: true, width: 1 } } } ]});var ds = []; for (var i = 0; i < json.top.length; i++) { ds.push({ game: json.top[i].game.name, viewers: json.top[i].viewers, channels: json.top[i].channels, image: json.top[i].game.box.large }); }});下面我将要创建一个面积图,用于展示一个视频游戏随着时间推移所增加的浏览数。图表开始的时候是没有任何数据的,但每个数秒中就会调用一次 Twitch API ,并返回浏览数量,同时动态更新面积图:
|
1
2
3
4
5
6
7
8
9
10
11
12
13
|
$("#streamChartContainer").dxChart({ title: "Viewers", commonSeriesSettings: { type: "splineArea", argumentField: "date" }, series: [ { valueField: "viewers", name: "Viewers" } ], argumentAxis: { valueMarginsEnabled: false }, legend: { visible: false }, animation: { enabled: false }}); |
注意在上面的代码中没有数据源,数据是从 Twitch API 中进行检索的。
|
1
2
3
4
5
6
7
8
9
10
11
12
13
14
15
16
17
18
19
|
var dataSource = []; function getStreamData() { var viewers = json.stream.viewers; dataSource.push({ date: new Date(), viewers: viewers }); $(‘#streamChartContainer‘).dxChart(‘option‘, ‘dataSource‘, dataSource); });} setInterval(function () { getStreamData();}, 5000); |
面积图:

标签:交互式 line ons cto 技术 ges ann kraken 3.1
原文地址:https://www.cnblogs.com/baiyanjun/p/8979374.html