标签:image 技术 而且 ted fine sse sof tar put
前面学习的cifar10项目虽小,但却五脏俱全。全面理解该项目非常有利于进一步的学习和提高,也是走向更大型项目的必由之路。因此,summary依然要从cifar10项目说起,通俗易懂的理解并运用summary是本篇博客的关键。
先不管三七二十一,列出cifar10中定义模型和训练模型中的summary的代码:
# Display the training images in the visualizer.
  tf.summary.image(‘images‘, images)
def _activation_summary(x):
  """Helper to create summaries for activations.

  Creates a summary that provides a histogram of activations.
  Creates a summary that measure the sparsity of activations.

  Args:
    x: Tensor
  Returns:
    nothing
  """
  # Remove ‘tower_[0-9]/‘ from the name in case this is a multi-GPU training
  # session. This helps the clarity of presentation on tensorboard.
  tensor_name = re.sub(‘%s_[0-9]*/‘ % TOWER_NAME, ‘‘, x.op.name)
  tf.summary.histogram(tensor_name + ‘/activations‘, x)
  tf.summary.scalar(tensor_name + ‘/sparsity‘, tf.nn.zero_fraction(x))
_activation_summary(conv1)
_activation_summary(conv2)
_activation_summary(local3)
_activation_summary(local4)
_activation_summary(softmax_linear)
def _add_loss_summaries(total_loss):
  """Add summaries for losses in CIFAR-10 model.

  Generates moving average for all losses and associated summaries for
  visualizing the performance of the network.

  Args:
    total_loss: Total loss from loss().
  Returns:
    loss_averages_op: op for generating moving averages of losses.
  """
  # Compute the moving average of all individual losses and the total loss.
  loss_averages = tf.train.ExponentialMovingAverage(0.9, name=‘avg‘)
  losses = tf.get_collection(‘losses‘)
  loss_averages_op = loss_averages.apply(losses + [total_loss])

  # Attach a scalar summary to all individual losses and the total loss; do the
  # same for the averaged version of the losses.
  for l in losses + [total_loss]:
    # Name each loss as ‘(raw)‘ and name the moving average version of the loss
    # as the original loss name.
    tf.summary.scalar(l.op.name +‘ (raw)‘, l)
    tf.summary.scalar(l.op.name, loss_averages.average(l))

  return loss_averages_op
tf.summary.scalar(‘learning_rate‘, lr)
# Add histograms for trainable variables.
  for var in tf.trainable_variables():
    tf.summary.histogram(var.op.name, var)
# Add histograms for gradients.
  for grad, var in grads:
    if grad is not None:
      tf.summary.histogram(var.op.name + ‘/gradients‘, grad)
# Build the summary operation based on the TF collection of Summaries.
summary_op = tf.summary.merge_all()

summary_writer = tf.summary.FileWriter(FLAGS.train_dir, sess.graph)

if step % 100 == 0:
        summary_str = sess.run(summary_op)
        summary_writer.add_summary(summary_str, step)
通过观察,聪明的大家不禁发现以下问题:
带着这些发现,我们又不禁产生下列疑问:
带着这些问题,打开官方的tutorial、API教程,这里是中文版。纯粹点说,summary和TensorBoard有关,也就是和tf的可视化有关。
上面列出的代码实际上给我们列出了一个过程,就是使用summary或者可视化tensorboard的过程,具体来说:
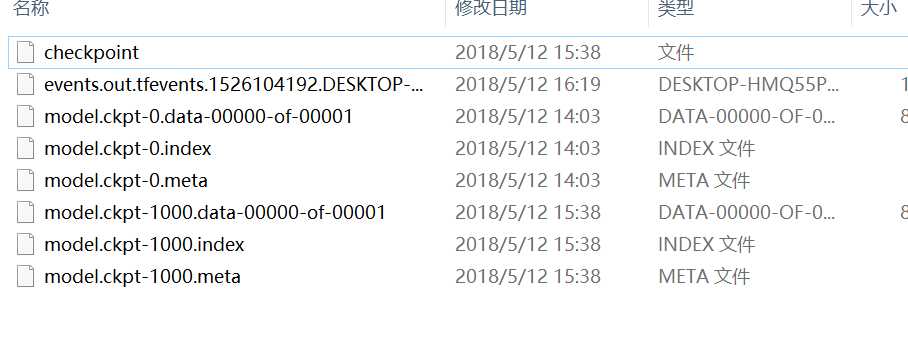
再从表面上来看,训练cifar10模型,得到的文件问下:

归纳一下就是:
model_checkpoint_path: "model.ckpt-1000"
all_model_checkpoint_paths: "model.ckpt-0"
all_model_checkpoint_paths: "model.ckpt-1000"
可见,该文件是记录中间保存模型的位置的,第一行表明最新的模型,其他行是保存的其它模型,随迭代次数从低到高排列。
if step % 100 == 0:
        summary_str = sess.run(summary_op)
        summary_writer.add_summary(summary_str, step)
里面就记录着整个汇总summary监测的数据以及模型图。这个文件是要在tensorboard可视化中要用到的。
上述三个model文件data和index是结合在一起确定变量的,meta是模型网络的结构,这和变量的加载联系起来,就会发现,加载时data和index是必须的,因此可以只加载变量不加载图结构,或者都加载,下面的例子是cifar10_eval.py中的例子,显然这是属于第一种,只加载了变量没有加载图结构而使用了默认图。
tf.app.flags.DEFINE_string(‘checkpoint_dir‘, ‘cifar10_train/‘,
                           """Directory where to read model checkpoints.""")

def eval_once(saver, summary_writer, top_k_op, summary_op):
  """Run Eval once.

  Args:
    saver: Saver.
    summary_writer: Summary writer.
    top_k_op: Top K op.
    summary_op: Summary op.
  """
  with tf.Session() as sess:
    ckpt = tf.train.get_checkpoint_state(FLAGS.checkpoint_dir)
    if ckpt and ckpt.model_checkpoint_path:
      # Restores from checkpoint
      saver.restore(sess, ckpt.model_checkpoint_path)
      # Assuming model_checkpoint_path looks something like:
      #   /my-favorite-path/cifar10_train/model.ckpt-0,
      # extract global_step from it.
      global_step = ckpt.model_checkpoint_path.split(‘/‘)[-1].split(‘-‘)[-1]
    else:
      print(‘No checkpoint file found‘)
      return
def evaluate():
  """Eval CIFAR-10 for a number of steps."""
  with tf.Graph().as_default():
也可以都加载,例如:
tf.app.flags.DEFINE_string(‘checkpoint_dir‘, ‘cifar10_train/‘,
                           """Directory where to read model checkpoints.""")
ckpt = tf.train.get_checkpoint_state(FLAGS.checkpoint_dir)
saver = tf.train.import_meta_graph(ckpt.model_checkpoint_path +‘.meta‘)
with tf.Session() as sess:
    saver.restore(sess,ckpt.model_checkpoint_path)
那如何用summary保存的训练日志启动tensorboard呢?
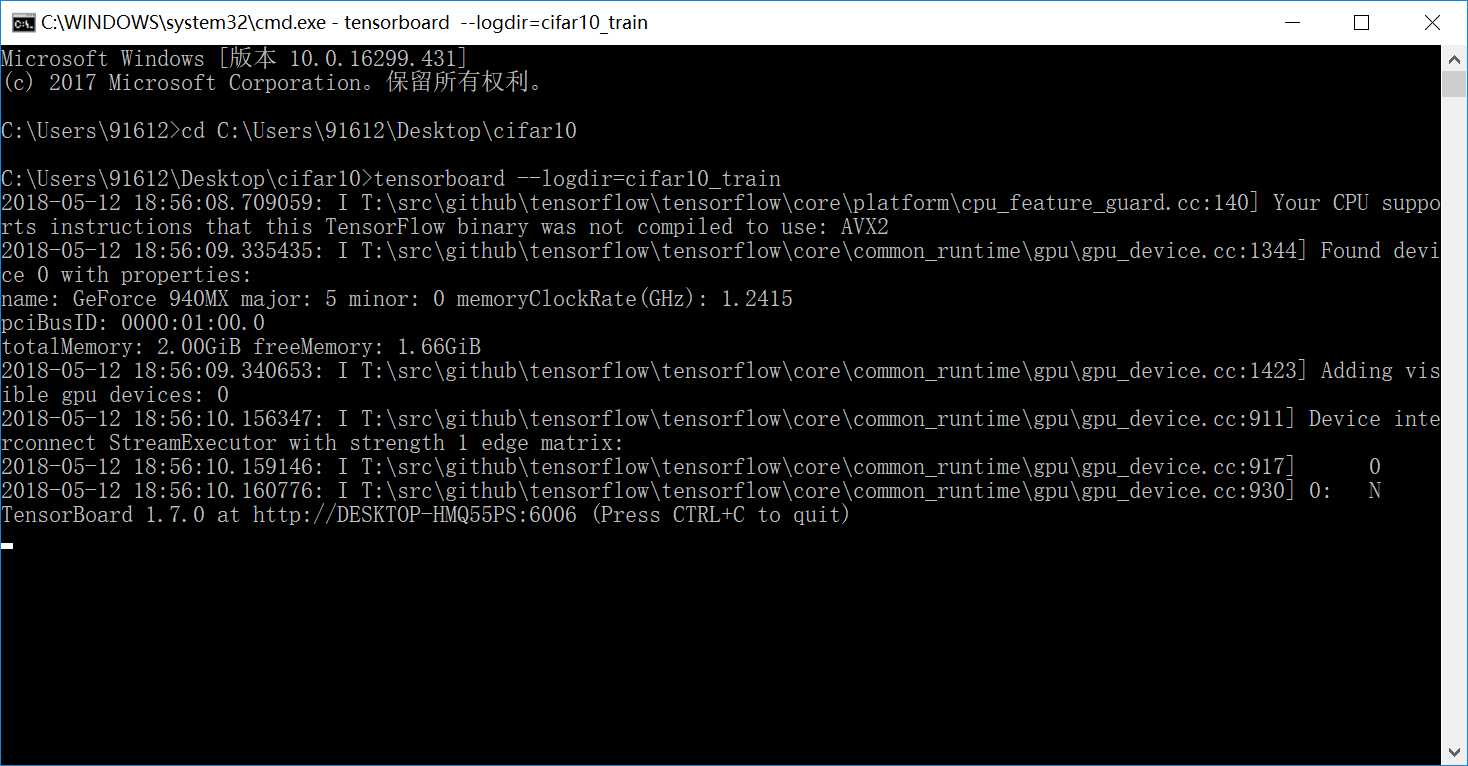
只需要tensorboard --logdir=cifar10_train,注意cifar10_train是日志所在的文件夹,同时请在cifar10_train所在目录下执行该命令,可得:

请用IE浏览器,或者其它高级的浏览器(chrome、Firefox)打开图片中出现的网址即可:http://DESKTOP-HMQ55PS:6006

到此为止,在表面上对summary类有了一定的认识,那接下来可以回答上述的三个疑问。
答:summary类是tensorboard可视化训练过程和图结构的基础,它相当于一个监测器,在哪加就说明想要监测哪,summary类没有执行任何实质性操作,tf就是这样,如果不建立会话启动的话,一切都是静态的,当然,summary类只是监测动态性,因此无实质性操作,只能说不同的函数有不同的功能和目的,这将在第三问探讨。
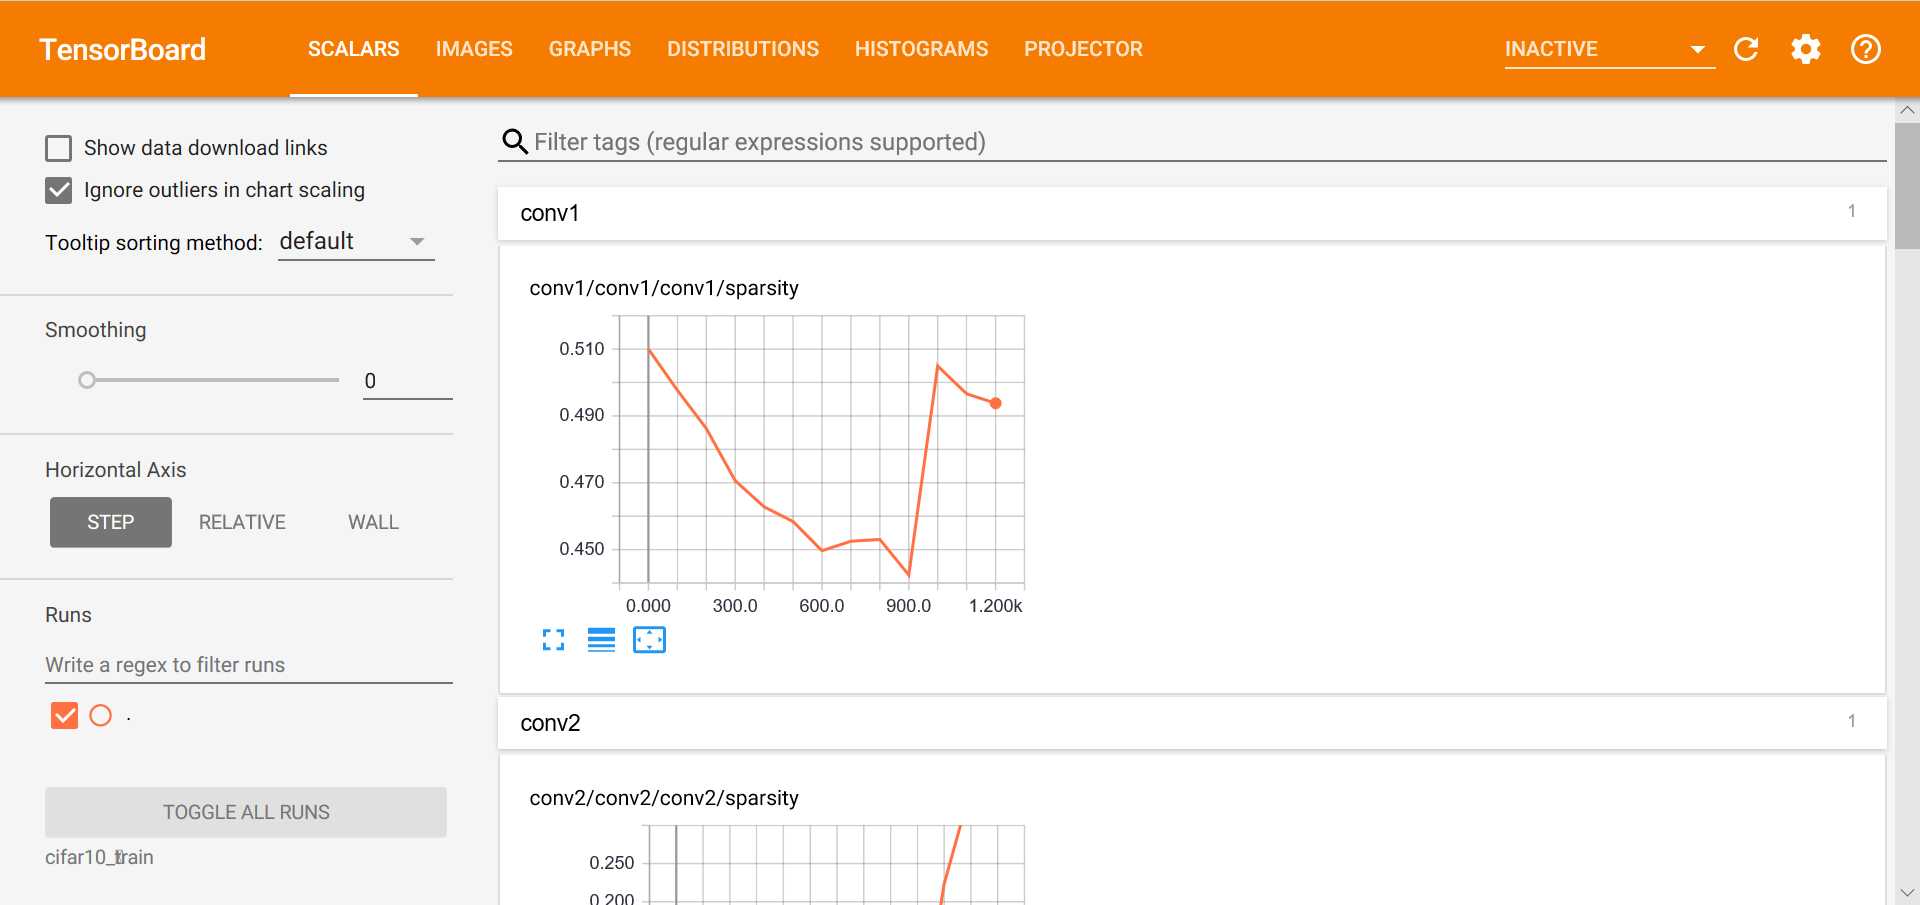
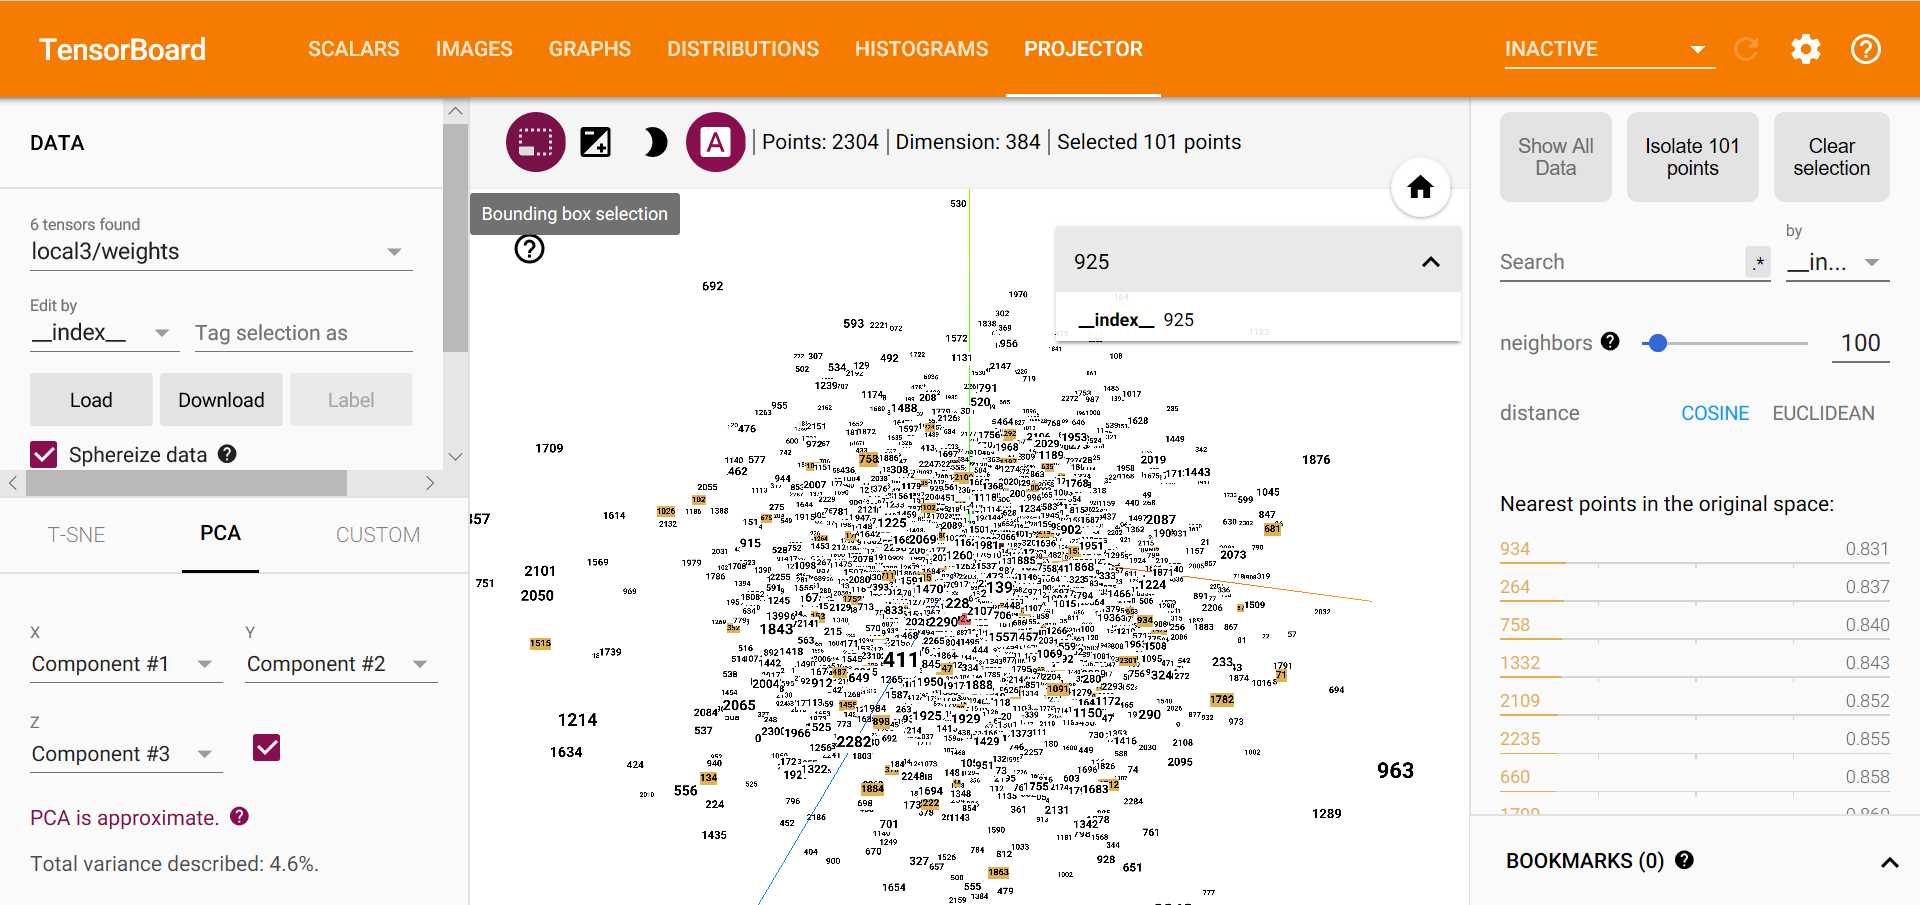
答:从tensorboard可视化的截图中可以发现,summary类包含的数据类型有:scalar、image、graph、histogram、audio。其中前四种在本项目中都出现了,只有audio类型没有出现。那它们是如何划分的呢?显然是按照类型划分的......scalar表示标量,image表示图片,graph表示网络节点模型图,histogram表示变量的直方图,audio表示音频数据,具体内容参考上述代码,也很容易明白,scalar通常表示单一的量,例如学习率、loss、AP等,而histogram表示的是统计信息,比如梯度、激活值等。graph通过summary_writer = tf.summary.FileWriter(FLAGS.train_dir, sess.graph)代码中的sess.graph得到。注意除此之外,tensorboard还有两个统计信息,一个是distributions,统计权值、偏置和梯度的分布,另一个是projector,包含T-SNE和PCA。

答:通常意义上只要符合上述5类的都可以创建summary,但是常用的有意义的量就上述常见的那些。summary类中常见的函数就上面那些,除此之外的很少遇到,详见API。
人人都说,创作需要灵感,甚至需要一些情愫,感动的、真诚的、又或是善意的,这就是生活,如果我们能把工作和学习当作是创作一样,又有什么遗憾呢?
通俗易懂之Tensorflow summary类 & 初识tensorboard
标签:image 技术 而且 ted fine sse sof tar put
原文地址:https://www.cnblogs.com/cvtoEyes/p/9022878.html