标签:mat nbsp tst 分享 sim space title http src
 1 #使用matplotlib作图
 2 import numpy as np
 3 import matplotlib.pyplot as plt
 4
 5 #x = np.linspace(start, stop, num=50, endpoint=True, retstep=False, dtype=None)
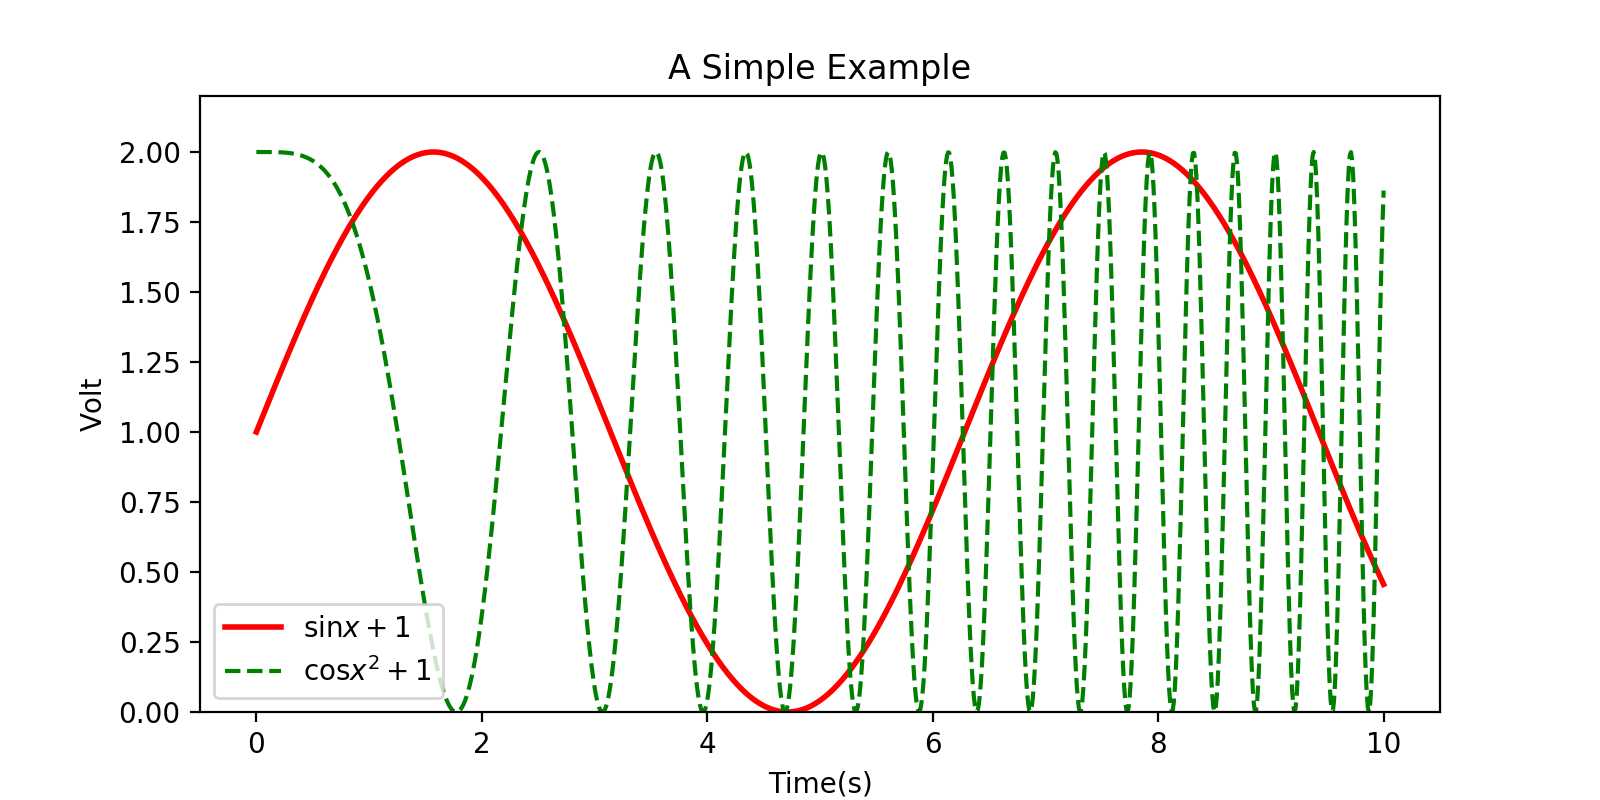
 6 x = np.linspace(0,10,1000) # 作图的变量自变量
 7 y = np.sin(x) + 1 #因变量y
 8 z = np.cos(x**2) + 1 #因变量z
 9
10 #plt.figure(num=None, figsize=None, dpi=None, facecolor=None, edgecolor=None,
11 #frameon=True, FigureClass=Figure, clear=False)
12 plt.figure(figsize=(8,4)) #设置图像的大小为宽8,高4,单位为英寸
13 plt.plot(x,y,label = ‘$\sin x+1$‘, color = ‘red‘, linewidth = 2) #作图设置标签、线条颜色,线条大小
14 plt.plot(x,z, ‘g--‘,label = ‘$\cos x^2 + 1$‘) #作图,设置标签、线条类型
15 plt.xlabel(‘Time(s)‘) #x轴名称
16 plt.ylabel(‘Volt‘) #y轴名称
17 plt.title(‘A Simple Example‘) #标题
18 plt.ylim(0,2.2) #显示y轴范围
19 plt.legend() #显示图例
20 plt.show() #显示作图效果

标签:mat nbsp tst 分享 sim space title http src
原文地址:https://www.cnblogs.com/xiyuan2016/p/9037493.html