标签:bar inf array 式表 百分比 api 100% charts formatter
字符串模板
模板变量有 {a}, {b},{c},{d},{e},分别表示系列名,数据名,数据值等。 在 trigger 为 ‘axis‘ 的时候,会有多个系列的数据,此时可以通过 {a0}, {a1}, {a2} 这种后面加索引的方式表示系列的索引。 不同图表类型下的 {a},{b},{c},{d} 含义不一样。 其中变量{a}, {b}, {c}, {d}在不同图表类型下代表数据含义为:
折线(区域)图、柱状(条形)图、K线图 : {a}(系列名称),{b}(类目值),{c}(数值), {d}(无)
散点图(气泡)图 : {a}(系列名称),{b}(数据名称),{c}(数值数组), {d}(无)
地图 : {a}(系列名称),{b}(区域名称),{c}(合并数值), {d}(无)
饼图、仪表盘、漏斗图: {a}(系列名称),{b}(数据项名称),{c}(数值), {d}(百分比)
更多其它图表模板变量的含义可以见相应的图表的 label.formatter 配置项。
示例:formatter: ‘{b0}: {c0}<br />{b1}: {c1}‘

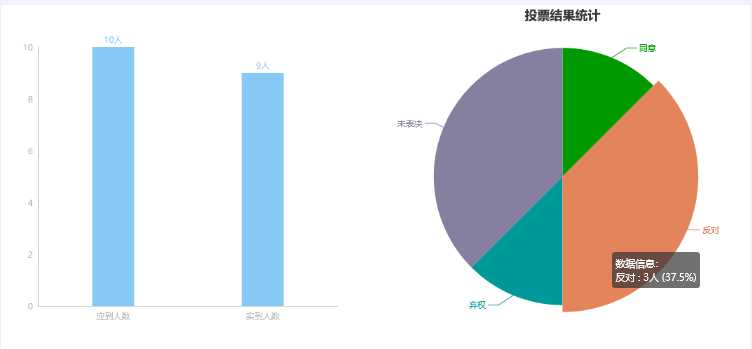
例一:饼状图
<div class="vote-bar">
        <div id="attitudeChart" style="width: 100%; height: 100%; margin: 0 auto;"></div>
</div>
     //饼状图
        var attitudeChart = echarts.init(document.getElementById(‘attitudeChart‘));
        var voteResultList = eval(‘(‘ + ‘${voteResultList}‘ + ‘)‘);
        var dataPie = new Array();

        for (var i = 0; i < voteResultList.length; i++) {
            dataPie.push({
                value:voteResultList[i].num,
                name:voteResultList[i].name
            });
        }

        var optionPie = {
                title:{
                    text:‘投票结果统计‘,
                    x:‘center‘
                },//标题
                tooltip:{
                    //a(系列名称),b(数据项名称),c(数值), d(百分比)
                    formatter:"{a}<br/>{b} : {c}人  ({d}%)"
                },//提示框内容
                calculable : true,
                series:[
                    {
                        name:‘数据信息:‘,
                        type:‘pie‘,//饼状图
                        data:dataPie
                    }
                ],
                color: [‘rgb(0,153,0)‘,‘rgb(207,120,82)‘,‘rgb(0,153,153)‘,‘rgb(134,127,160)‘,‘rgb(252,157,154)‘,‘rgb(249,205,173)‘]
        }
        attitudeChart.setOption(optionPie);
例二:柱状图
<div class="vote-bar">
        <div id="countChart" style="width: 100%; height: 100%; margin: 0 auto;"></div>
</div>
        var countChart = echarts.init(document.getElementById(‘countChart‘));
        var dataAxis = [‘应到人数‘,‘实到人数‘];
        var data = [‘${conference.tobepeople}‘, ‘${checkInCount}‘];
        var option = {
            tooltip : {
                formatter : ‘{b} ({c})‘
            },
            xAxis : [{
                type : ‘category‘,
                axisTick : {
                    show : false
                },
                axisLabel : {
                    show : true    ,
                    color: ‘#B7B7B7‘
                },
                splitLine : {
                    show : false
                },
                axisLine : {
                    show : true,
                    lineStyle: {
                        color: "#ccc"
                    }
                },
                data: dataAxis
            }],
            yAxis : [{
                type : ‘value‘,
                axisTick : {
                    show : false
                },
                axisLabel : {
                    show : true    ,
                    color: ‘#B7B7B7‘
                },
                splitLine : {
                    show : false
                },
                axisLine : {
                    show : true,
                    lineStyle: {
                        color: "#ccc"
                    }
                }
            }],
            series : [ {
                name : ‘‘,
                type : ‘bar‘,
                barWidth : 60,
                label: {
                    normal: {
                        show: true,
                        position: ‘top‘,
                        formatter: ‘{c}人‘
                    }
                },
                itemStyle : {
                    normal : {
                        color : ‘#86c9f4‘
                    }
                },
                data : data,
            },

            ]
        };
        countChart.setOption(option);
例三:地图


参考链接:http://echarts.baidu.com/option.html#tooltip.formatter
标签:bar inf array 式表 百分比 api 100% charts formatter
原文地址:https://www.cnblogs.com/lijianda/p/9038646.html