标签:.ajax 而不是 orm ali pre sdn show 内容 blog
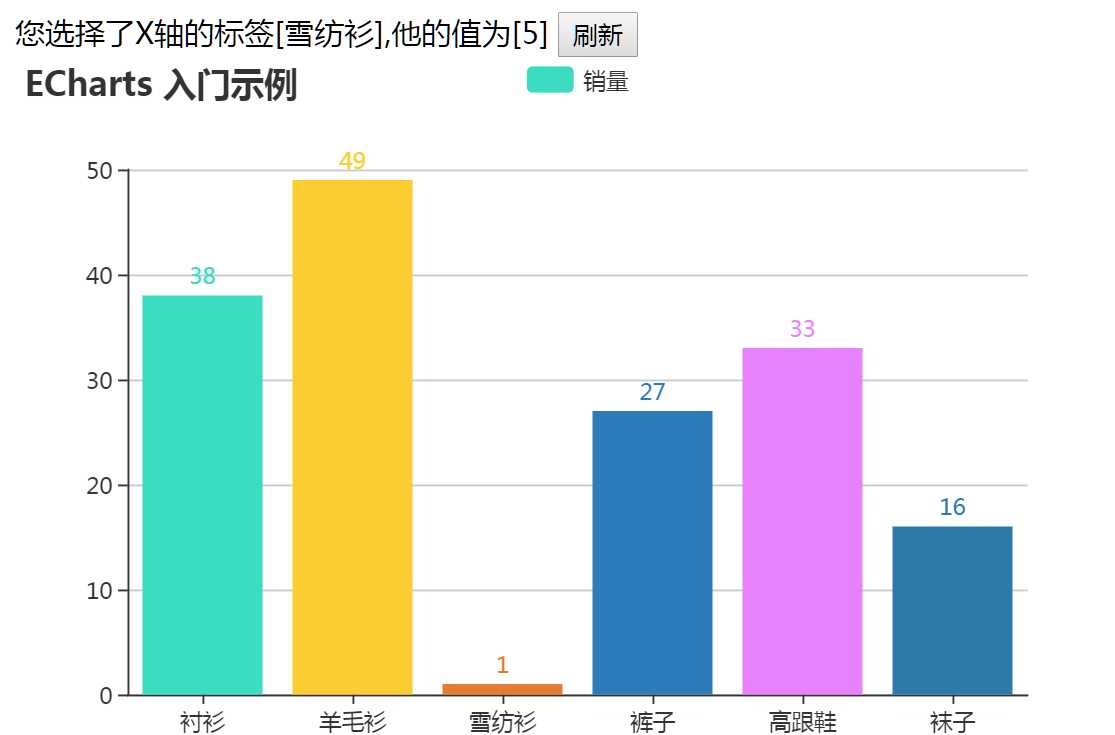
本示例实现了以下功能:
1.点击刷新按钮,仅刷新柱状图,而不是整个页面
2.点击柱状内容刷新柱状图,并更新title
3.点击X轴,Y轴更新title,并弹出alert。
源码代码如下:
<!DOCTYPE html>
<html>
<head>
    <meta http-equiv="Content-Type" content="text/html; charset=UTF-8">
    <title>ECharts</title>
    <!-- <script src="http://echarts.baidu.com/dist/echarts.min.js"></script>  -->
    <script src="https://cdn.bootcss.com/echarts/4.0.2/echarts.js"></script>
    <script src="https://cdn.bootcss.com/jquery/3.3.1/jquery.js"></script>
</head>
<body>
    <!-- 为ECharts准备一个具备大小(宽高)的Dom -->
    您选择了X轴的标签[<span id="xAxisTag"></span>],他的值为[<span id="barValue"></span>]
    <input type="submit" name="" value="刷新" onclick="refresh()">
    <div id="main" style="width: 600px;height:400px;"></div>

</body>
<script type="text/javascript">
  function getSeriesData(){

      //根据js方法本身的加载顺序,此方法需要定义在myChart前面
      //此处可以通过后台生成数据,这样后台就无需返回整个option,只需要返回动态的数据部分即可
      // $.ajax({
      //     type: ‘GET‘,
      //     url: "getSeriesData",
      //     cache: false,
      //     async : false,
      //     dataType: ‘json‘,
      //     success: function (result) {
      //         seriesdata = result;
      //     },
      //     error: function (result, XMLHttpRequest, textStatus, errorThrown) {
      //         // 状态码
      //         // console.log(XMLHttpRequest.status);
      //         // console.log(XMLHttpRequest.toLocaleString());
      //         // 状态
      //         // console.log(XMLHttpRequest.readyState);
      //         // 错误信息
      //         // console.log(textStatus);
      //     }
      // });

        var n1 = Math.floor(Math.random()*50+1);
        var n2 = Math.floor(Math.random()*50+1);
        var n3 = Math.floor(Math.random()*50+1);
        var n4 = Math.floor(Math.random()*50+1);
        var n5 = Math.floor(Math.random()*50+1);
        var n6 = Math.floor(Math.random()*50+1);
        seriesdata = [n1, n2, n3, n4, n5, n6];

      return seriesdata;
  }

  function getxAxisData(){
    //同样适用以ajax的方式从后台获取数据
    xAxisData = ["衬衫","羊毛衫","雪纺衫","裤子","高跟鞋","袜子"];
    return xAxisData;
  }

  function getSaleOption(){
      saleOption = {
            title: {
                text: ‘ECharts 入门示例‘
            },
            tooltip: {},
            legend: {
                data:[‘销量‘]
            },
            xAxis: {
                // data: ["衬衫","羊毛衫","雪纺衫","裤子","高跟鞋","袜子"],
                data : getxAxisData(),
                triggerEvent:true,
                axisTick: {
                    alignWithLabel: true //坐标值是否在刻度中间
                }

            },
            yAxis: {triggerEvent:true},
            series: {
                name: ‘销量‘,
                type: ‘bar‘,
                //data: [n1, n2, n3, n4, n5, n6],
                // data : seriesdata,
                data : getSeriesData(),
                itemStyle: {
                    normal: {
                        color: function(params) {
                      var colorList = [‘#2eddc1‘,‘#FCCE10‘,‘#E87C25‘,‘#277bbb‘,‘#E87fff‘,‘#277aaa‘];
                            //若返回的list长度不足,不足部分自动显示为最后一个颜色
                        return colorList[params.dataIndex]
                      },
                        label: {
                            show: true,
                            position: ‘top‘
                        }
                    }
                }
            }
        };

        return saleOption;
  }


</script>
<script type="text/javascript">
        // 基于准备好的dom,初始化echarts实例
        var myChart = echarts.init(document.getElementById(‘main‘));

        // 指定图表的配置项和数据
        var option = getSaleOption();
        // 使用刚指定的配置项和数据显示图表。
        myChart.setOption(option);

        myChart.on(‘click‘, function (params) {
            //param具体包含的参数见 https://blog.csdn.net/allenjay11/article/details/76033232
            updatePage(params);

            if (params.componentType == "series"){
                refresh();
            }
        });
    </script>

<script type="text/javascript">
  function updatePage(params){
    //点击内容区域
    if (params.componentType == "series"){
        tag = option.xAxis.data[params.dataIndex];
        value = params.value;
        var xAxisTag = $("#xAxisTag");
        xAxisTag.html(tag);
        var barValue = $("#barValue");
        barValue.html(value);
    }

    //点击X轴
    if (params.componentType == "xAxis"){
        tag = params.value;
        value = "";
        var xAxisTag = $("#xAxisTag");
        xAxisTag.html(tag);
        var barValue = $("#barValue");
        barValue.html(value);
        alert("单击了"+params.value+",X轴标签");
    }
    //点击Y轴
    if (params.componentType == "yAxis"){
        tag = null;
        value = params.value;
        var xAxisTag = $("#xAxisTag");
        xAxisTag.html(tag);
        var barValue = $("#barValue");
        barValue.html(value);
        alert("单击了"+params.value+",Y轴标签");
    }

  };

  function refresh(){

      //局部刷新series内容
      //此处没有用常用的刷新div等方法,而是直接改变了option的值,然后重新赋值给myChart

      //简化方法,调用getSeriesData更新数据。
      option.series.data = getSeriesData();

      myChart.setOption(option);
  };

</script>
</html>
显示效果如下:

标签:.ajax 而不是 orm ali pre sdn show 内容 blog
原文地址:https://www.cnblogs.com/huanghongbo/p/9059987.html