标签:src otl import col dataframe plt .data port sub
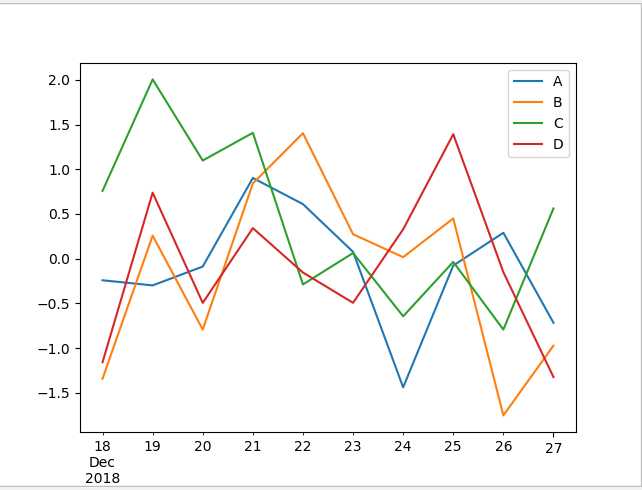
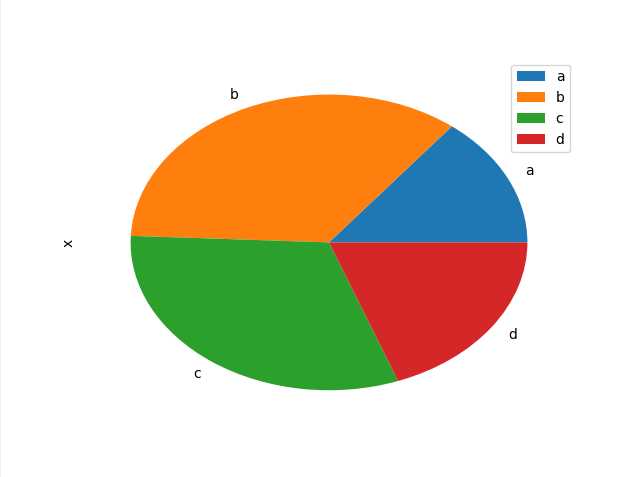
#encoding:utf8
import pandas as pd
import numpy as np
import matplotlib.pyplot as plt
df = pd.DataFrame(np.random.randn(10,4),index=pd.date_range(‘2018/12/18‘,
   periods=10), columns=list(‘ABCD‘))
plt.figure()
df.plot()
df = pd.DataFrame(3 * np.random.rand(4), index=[‘a‘, ‘b‘, ‘c‘, ‘d‘], columns=[‘x‘])
df.plot.pie(subplots=True)
plt.show()
#或者
#encoding:utf8
import pandas as pd
import numpy as np
from pylab import *
df = pd.DataFrame(np.random.randn(10,4),index=pd.date_range(‘2018/12/18‘,
   periods=10), columns=list(‘ABCD‘))
df.plot()
df = pd.DataFrame(3 * np.random.rand(4), index=[‘a‘, ‘b‘, ‘c‘, ‘d‘], columns=[‘x‘])
df.plot.pie(subplots=True)
show()
标签:src otl import col dataframe plt .data port sub
原文地址:https://www.cnblogs.com/ggzhangxiaochao/p/9094387.html