标签:imei 表达式 语法 结果 正整数 核心 space mbr alpha
第3章 灰度变换与空间滤波(2)
3.3 直方图处理与函数绘图
基于从图像亮度直方图中提取的信息的亮度变换函数,在诸如增强、压缩、分割、描述等方面的图像处理中扮演着基础性的角色。本节的重点在于获取、绘图并利用直方图技术进行图像增强。直方图的其他应用将在后续章节中加以介绍。
3.3.1 生成并绘制图像的直方图
一幅数字图像在范围[0,G]内总共有L个灰度级,其直方图定义为离散函数:
\[
h(r_k)=n_k
\]
其中,\(r_k\)是区间[0,G]内的第k级亮度,\(n_k\)是灰度级为\(r_k\)的图像中的像素数。对于uint8类图像,G的值为255;对于uint16类图像,G的值为65535;对于double类图像,G的值为1.0。Matlab中的索引不能为0,因此\(r_1\)相当于灰度级0,\(r_2\)相当于灰度级1,如此等等,\(r_L\)相当于灰度级G。其中,uint8类图像或者uint16类图像中G=L-1。通常,我们会用到归一化直方图,即使用所有元素\(h(r_k)\)除以图像中的像素总数n所得到的图像:
\[
p(r_k)=\frac{r_k}{n}=\frac{n_k}{n}
\]
其中,\(k=1,2,...,L\)。由基本的概率论知识,我们可知\(p(r_k)\)表示灰度级\(r_k\)出现的频数。
在处理图像直方图的工具箱中,核心函数是imhist,其基本语法为:
其中,f为输入图像,h为其直方图\(h(r_k)\),b是用于形成直方图的“收集箱个数”(即灰度级的个数)。若b未包含在此变量中,则其默认值为256。一个“收集箱”仅仅是亮度标度范围的一小部分。例如,若我们要处理衣服uint8类图像并令b=2,则亮度标度范围被分成两部分:0至127和128至255。所得的直方图将有两个值:h(1)等于图像在区间[0,127]内的像素总数,h(2)等于图像在区间[128,255]内的像素总数。使用表达式:
就可以简单地获得归一化直方图。函数numel(f)给出数组f中元素的个数。
案例3.4 计算并绘制图像直方图
考虑图3.1(a)所示图像f,调用imhist函数绘制其直方图:
>> f=imread(‘Fig0203(a).tif‘);
>> imhist(f)

这是工具箱中默认显示的直方图,但绘制直方图的方法还有许多,下面介绍一些具有代表性的绘制选项。
(1)直方图经常利用条形图来绘制。为达到目的,使用函数
其中,v是一个行向量,它包含将被绘制的点;horz是一个与v有着相同维数的向量,它包含水平标度值的增量;width是一个值在0和1之间的数。换句话说,horz的值给出了水平增量,z的值对应垂直量。若省略horz,则水平轴会从0至length(v)等分为若干个单位。当width的值为1时,竖条较明显;当width的值为0时,竖条是简单的垂直线,如上图所示。width的默认值为0.8。绘制条形图时,我们通常会将水平轴等分为几段,以便降低水平轴的分辨率。下面的语句将生成一幅条形图,其水平轴以10个灰度级为一组:
1)原始书籍中的代码及结果:
>> h=imhist(f);
>> h1=h(1:10:256);
>> horz=1:10:256;
>> bar(horz,h1)
>> axis([0 255 0 15000])
>> set(gca,‘xtick‘,0:50:255)
>> set(gca,‘ytick‘,0:2000:15000)

2)最新书籍中的代码和结果:
>> h=imhist(f,25);
>> horz=linspace(0,255,25);
>> bar(horz,h)
>> axis([0 255 0 600000])
>> set(gca,‘xtick‘,0:50:255)
>> set(gca,‘ytick‘,0:200000:600000)

注意到,直方图中,灰度级高端出现的峰值在条形图中消失了,这是由于绘制的图形中使用了较大的水平增量值。垂直标度比直方图的跨度范围宽,这是因为每个条的高度都由某个范围的所有像素决定,而不是由单个值的像素决定。(原始书籍中的代码和结果绘制的是单个值的像素)
在最新书籍的代码中,第4条语句用于扩展垂直轴的低端范围,以便于视觉分析,水平轴的设置值与直方图中的范围相同。函数axis的语法格式之一如下:
axis([horzmin horzmax vertmin vertmax])
该函数设置了水平轴和垂直轴的最大和最小值。在最后两条语句中,gca意味着“获得当前轴”(即最终显示的图形的轴),xtick和ytick按所示的间隔设置水平轴和垂直轴的刻度。另一种使用的语法如下:
设置的轴限制了数据的范围。轴的标尺可以附加到使用下列函数产生的图像的水平轴和垂直轴上:
xlabel(‘text string‘,‘fontsize‘,size)
ylabel(‘text string‘,‘fontsize‘,size)
其中,size为插入点处字体大小,以磅为单位。在图的主体中可以利用text函数加入文本:
text(xloc,yloc,‘text string‘,‘fontsize‘,size)
其中,xloc与yloc定义为加入文字的起始位置。要特别注意:设置参考轴线值与标度值的函数要在绘图函数之后使用。
利用title函数可以给图形加入标题,基本语法如下:
titlestring为在标题处出现的字符串,将显示在图像上部的中央。
(2)杆状图与条形图相似,语法如下:
stem(horz,z,‘LineSpec‘,‘fill‘)
其中,z为包含了所需绘制点的行向量;horz是对bar的具体描述,与之前一样,如果省略horz,水平轴会从0至length(z)等分为若干个单位。
参数LineSpec是下表中的三元组:
| k |
黑 |
- |
实线 |
+ |
加号 |
| w |
白 |
-- |
虚线 |
o |
圆圈 |
| r |
红 |
: |
点线 |
* |
星号 |
| g |
绿 |
-. |
点划线 |
. |
点 |
| b |
蓝 |
|
|
x |
叉 |
| c |
青 |
|
|
s |
方块 |
| y |
黄 |
|
|
d |
菱形 |
| m |
深红 |
|
|
^ |
向上三角形 |
|
|
|
|
> |
向右三角形 |
|
|
|
|
< |
向左三角形 |
|
|
|
|
P |
五角星 |
|
|
|
|
h |
六角星 |
例如stem(horz,h,‘r--p‘)会生成一幅杆状图,线条与标记点都是红色,线条为虚线,标记点为五角星。如果使用了 fill,那么标记点用三元组中的第一个元素指定的颜色填充。默认颜色为蓝色,默认线条为实线,默认标记点为圆圈。
>> h=imhist(f,25);
>> horz=linspace(0,255,25);
>> stem(horz,h,‘fill‘)
>> axis([0 255 0 60000])
>> axis([0 255 0 600000])
>> set(gca,‘xtick‘,0:50:255)
>> set(gca,‘ytick‘,0:200000:600000)

下面考虑plot函数,该函数将一组点用直线连接起来,语法如下:
其中,各个参数在先前介绍杆状图时都有定义。和函数stem一样,plot的属性也由三个值指定,对于plot,默认值时不带标记的实的蓝线。如果指定了三元组,那么中间值是空的,即不画线。和以前一样,如果省略horz,水平轴会从0至length(z)等分为若干个单位。
>> hc=imhist(f);
>> plot(hc);
>> axis([0 255 0 60000])
>> set(gca,‘xtick‘,0:50:255)
>> set(gca,‘ytick‘,0:20000:60000)

plot函数经常被用作显示变换函数。
在前面的讨论中,坐标轴的取值范围和刻度线都是人工设定的。利用ylim和xlim函数可以自动设定取值范围及刻度,为达到此目的,使用如下语法形式:
ylim(‘auto‘)
xlim(‘auto‘)
对于这两个函数语法上可能发生变化,还有手工选项:
ylim([ymin ymax])
xlim([xmin xmax])
允许人为规定取值限制。如果只对一个轴指定限制,那么另一个轴的限制默认为auto形式。
在提示符处键入hold on保留现有图形及某些轴的属性,从而使后续绘图命令在已有图形的基础上执行。
在处理函数句柄时,另一个特别有用的绘图函数是fplot,基本语法如下:
fplot(fhandle,limits,‘LineSpec‘)
其中,fhandle是函数句柄,limits是指定了x轴限制[xmin xmax]向量。回顾timeit函数可知,通过使用函数句柄,可使基本函数的语法与被处理函数的参数无关。例如,要在范围[-2 2]用点绘制双曲正切函数tanh,可以编写如下程序:
>> fhandle=@tanh;
>> fplot(fhandle,[-2 2],‘:‘)

函数fplot使用一种自动的自适应增量控制方案来产生典型图形,在变化率最高之处集中了更多细节。这样,只有绘图限制是必须由用户指定的。尽管简化了绘图任务,但自动功能有时会产生意外的结果。例如,如果某个函数对可预见的间隔最初是0,fplot可能假定该函数是0并为整个间隔绘制0。在这种情况下,可为要绘制的函数指定最小点数,语法如下:
fplot(fhandle,limits,‘LineSpec‘,n)
指定n>=1能够强制fplot绘制最小点数为n+1的函数,使用的步长是(1/n)*(upper_lim-lower_lim);其中的upper_lim和lower_lim是指在limits中指定的最高和最低限制
3.3.2 直方图均衡化
假设灰度级为归一化在[0,1]范围内的连续量,让\(p_r(r)\)代表一幅给定图像的灰度级的概率密度函数(PDF),下标用来区分输入图像和输出图像的概率密度函数。假设我们对输入灰度进行下列变换,得到输出(处理后的)灰度级s:
\[
s=T(r)=\int^{r}_{0}p_r(w)dw
\]
式中的w是积分虚变量。可以看出,输出灰度级的概率密度函数是均匀的,也就是:
\[
p_s(s)=\begin{cases}1,~0\leq s\leq 1\0,\text{其他}\end{cases}
\]
注:对上述概率密度的补充说明
假设输出灰度级的概率分布函数为\(F_s(y)\),则
\[
\begin{aligned}
F_s(y)&=P(s<y)=P(T(r)<y)\&=P(r<T^{-1}(y))=F_r(T^{-1}(y))=\int_{0}^{T^{-1}(y)}p_r(w)dw
\end{aligned}
\]
因此,\(p_s(y)=F‘_{s}(y)=p_r(T^{-1}(y))\frac{dT^{-1}(y)}{dy}=p_r(x)\frac{dx}{dy}\),其中\(y=\int_{0}^{x}p_r(w)dw\),所以\(\frac{dy}{dx}=p_r(x)\),最终 \(p_s(y)=1\)。
换句话说,前面的变换生成一幅图像,这幅图像的灰度级是等概率的。此外,灰度覆盖了整个[0,1]范围。灰度级均衡化处理的最终结果是一幅扩展了动态范围的图像,具有较高的对比度。注意,这个变换函数实质上是真正的累积分布函数
当灰度级为离散值时,利用直方图并采用前面介绍的直方图均衡化技术。一般来说,虽然由于变量的离散特性,处理后的图像直方图也不会完全均匀。让\(p_r(r_j),j=0,1,2,...,L-1\)代表给定图像的灰度级直方图。在归一化直方图中,各个值大致是图像取各灰度级的概率。对于离散的灰度级,我们采用求和的方式,将均衡化变换成为下列形式:
\[
s_k=T(r_k)=\sum_{j=0}^{k}p_r(r_j)=\sum^{k}_{j=0}\frac{n_j}{n}
\]
式中,k=0,1,2,...,L-1,且\(S_k\)是输出图像的灰度值,对应于输入图像的灰度值为\(r_k\)。
直方图均衡化由工具箱中的histeq函数实现,语法如下:
其中,f为输入图像,nlev为输出图像设定的灰度级数。若nlev与L(输入图像中可能灰度级的总数)相等,则histeq直接执行变换函数。若nlev小于L,则histeq试图分配灰度级,从而能够得到近似平坦的直方图。与imhist函数不同,histeq中默认nlev=64。在很大程度上,我们将nlev赋值为灰度级的最大可能数量(通常为256),因为这样能够利用刚才描述的直方图均衡化方法,得到较为正确的执行结果
例3.5 直方图均衡化
下图(a)是电子显微镜下花粉的图像,近似放大了700倍,就所需要的图像增强而言,这幅图像最突出的特点是较暗,且动态范围较低。这些特点在图(b)所示的直方图中是很明显的,其中图像较暗的特点导致直方图偏向于灰度级的暗端。从直方图相对于整个灰度范围非常狭窄的事实可以看出,较低的动态范围是很明显的。令f表示输入图像,下列命令可产生图(a)到图(d)所示的结果:
>> f=imread(‘Fig0208(a).tif‘);
>> subplot(221);imshow(f);xlabel(‘(a)‘);
>> subplot(222);imhist(f);ylim(‘auto‘);xlabel(‘(b)‘);
>> g=histeq(f,256);subplot(223);imshow(g);xlabel(‘(c)‘);
>> subplot(224);imhist(g);ylim(‘auto‘);xlabel(‘(d)‘);

图(c)所示的图像是直方图均衡化之后的结果,在平均灰度及对比度方面的改进是非常明显的。如图(d)所示,这些特点在图像的直方图中也是很明显的。对比度增加源于直方图在整个灰度级上的显著扩展。灰度级的增加源于均衡化之后的图像直方图中灰度级平均值高于原始值。虽然刚刚讨论的直方图均衡化方法并不能生成平坦的直方图,但却具有增加图像灰度级动态范围的特性。
正如先前提到的那样,在直方图均衡化过程中使用的变换函数是归一化直方图的累积求和。可以利用cumsum函数实现变换功能:
>> hnorm=imhist(f)./numel(f);
>> cdf=cumsum(hnorm);
>> x=linspace(0,1,256);
>> plot(x,cdf)
>> axis([0 1 0 1]);
>> set(gca,‘xtick‘,0:.2:1)
>> set(gca,‘ytick‘,0:.2:1)
>> xlabel(‘输入灰度值‘,‘fontsize‘,9);
>> ylabel(‘输出灰度值‘,‘fontsize‘,9);

可以看到,变换函数把输入灰度级低端中较窄的灰度级映射到输出图像的整个灰度范围,观察之前直方图均衡化的图像,可以发现,图像对比度的改进是很明显的。
3.3.3 直方图匹配法(规定化)
直方图均衡化生成了自适应的变换函数,从这个意义上讲,它是以给定图像的直方图为基础的。然而,一旦对一幅图像的变换函数计算完毕,它将不再改变,除非直方图发生变化。在前一节中我们提到,直方图均衡化通过把输入图像的灰度级扩展到较宽灰度范围来实现图像增强。在本节,我们将说明这种方法有时并不能导致成功的结果。特别是,能够规定在进行处理后想要的图像直方图的形状,这在某些应用中是非常有用的。生成具有特定直方图图像的方法,被称作直方图匹配法或直方图规定化。
这种方法的原理是:考虑归一化之后在[0,1]区间内的连续灰度级,令\(r\)和\(z\)分别表示输入图像和输出图像的灰度级。输入图像的灰度级有概率密度函数\(p_r(r)\),输出图像的灰度级具有规定的概率密度函数\(p_z(z)\)。上一节中,变换:
\[
s=T(r)=\int_{0}^{r}p_r(w)dw
\]
得到的灰度级s具有均匀的概率密度函数\(p_s(s)\)。假设定义的变量\(z\)具有下列特性:
\[
H(z)=\int_{0}^{z}p_z(w)dw=s
\]
我们要寻找的是灰度级为\(z\)的图像,且具有特定的概率密度\(p_z(z)\)。由前面两个等式可得:
\[
z=H^{-1}(s)=H^{-1}[T(r)]
\]
***
注:\(s\)是均衡化的灰度级,对一幅图像,假设在灰度级为\(r\)的情况下,概率密度函数为\(p_r(r)\),作均衡化变换,有\(s=T(r)\);假设在灰度级为\(z\)的情况下,概率密度函数为\(p_z(z)\),作均衡化变换,有\(s=H(z)\)
可以由输入图像得到\(T(r)\),此时只要找到\(H^{-1}\),就能利用前面的等式得到变换后的灰度级\(z\),概率密度函数为指定的\(p_z(z)\)。当处理离散变量时,若\(p(z_k)\)是正确的直方图概率密度函数(也就是说,直方图具有单位面积且各亮度值均非负),则\(H\)的反变换存在,且元素值非零(也就是说,\(p(z_k)\)中没有统计堆栈是空的)。如同在直方图均衡化中一样,前面的方法的离散实现可得到对特定直方图的近似。
工具箱中使用histeq的下列语法实现直方图匹配:
其中,f为输入图像,hspec为特定的直方图(某特定值的行向量),g为输出图像,直方图近似于指定直方图hspec。向量中包含对应等分的空间统计堆栈的整数值。histeq的特性是当length(hspec)比图像f中的灰度级小很多时,图像g的直方图通常会较好地匹配hspec。
例3.6 直方图匹配
图(a)显示了一幅火星天体福布司的图像f,图(b)显示了利用imhist(f)函数得到的直方图。这幅图像受大片较暗区域控制,造成直方图中的大部分像素都集中在灰度级的暗端。乍一看,可能的结论是:借助直方图均衡化增强该图像是一种较好方法,从而使较暗区域中的细节更加明显。然而利用下述命令,得到的图(c)只是一幅有"退色"现象且不是特别好的图像。对此,通过研究均衡化之后的图像,从图(d)的直方图可以看出原因,这里灰度级仅仅是移到了较高端的那半边,给出了一幅低对比度并且有褪色现象的图像。灰度级的移动是由于在原始直方图中,灰度级在0及其附近区域过于集中,由直方图得到的累积变换函数非常陡,因此,把在低端过于集中的像素点映射到了灰度级的高端。
>> f=imread(‘Fig0210(a).tif‘);
>> subplot(221);imshow(f);xlabel(‘(a)‘)
>> subplot(222);imhist(f);xlabel(‘(b)‘)
>> f1=histeq(f,256);subplot(223);imshow(f1);xlabel(‘(c)‘)
>> subplot(224);imhist(f1);xlabel(‘(d)‘)

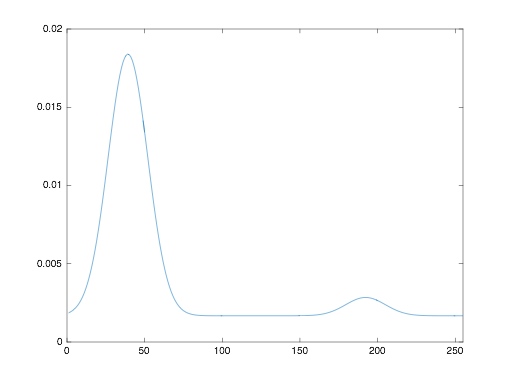
一种能够补救这种现象的方法就是利用直方图匹配法,期望的直方图在灰度级低端有较小的集中范围,并能够保留原始图像直方图的大体形状。从图(b)中可以看到,直方图基本是双峰的,其中一个较大的模态在原点处,另一个较小的模态在灰度级的高端。这些类型的直方图可以被模型化,例如用多模态的高斯函数模拟。下列M函数计算了一个归一化到单位区域的双模态高斯函数,因而可被用作特定的直方图:
function p=twomodegauss(m1,sig1,m2,sig2,A1,A2,k)
% TWOMODEGAUSS(M1,SIG1,M2.SIG2,A1,A2,K)generates a two-mode, Gaussian-like
% function in the interval [0,1]. P is a 256-element vector normalzied so
% that SUM(P)=1. The mean and standrad deviation of the modes are (M1,SIG1)
% and (M2,SIG2), respectively. A1 and A2 are the amplitude values of the
% two modes. Since the output is normalized, only the relative values of A1
% and A2 are important. K is an offset value that raises the "floor" of the
% function. A good set of values to try is M1=0.15, SIG1=0.05,
% M2=0.75, SIG2=0.05, A1=1, A2=0.07 and K=0.002

c1=A1*(1/((2*pi)^0.5)*sig1);
k1=2*(sig1^2);
c2=A2*(1/((2*pi)^0.5)*sig2);
k2=2*(sig2^2);
z=linspace(0,1,256);
p=k+c1*exp(-((z-m1).^2)./k1)+c2*exp(-((z-m2).^2)./k2);
p=p./sum(p(:));
function p=manualhist
%MANUALHIST Generates a two-mode histogram interactively.
% P=MANUALHIST generates a two-mode histogram using function
% TWOMODEGAUSS(m1,sig1,m2,sig2,A1,A2,k). m1 and m2 are the means of the two
% modes and must be in the range [0,1]. SIG1 and SIG2 are the standard
% deviations of the two modes. A1 and A2 are amplitude values, and k is an
% offset value that raises the floor of the histogram. The number of
% elements in the histogram vector P is 256 and sum(p) is normlized to 1.
% MANUALHIST repeatedly prompts for the paramenters and plots the resulting
% histogram until the user types an ‘x‘ to quit, and then it returns the
% last histogram computed.
%
% A good set of starting values is: (0.15,0.05,0.74,0.05,1,0.07,0.002)
% Initialize.
repeats=true;
quitnow=‘x‘;

% Compute a default histogram in case the user quits before estimating at
% least one histogram.
p = twomodegauss(0.15,0.05,0.75,0.05,1,0.07,0.002);
% Cycle until an x is input.
while repeats
    s=input(‘Enter m1, sig1, m2, sig2, A1, A2, k OR x to quit:‘,‘s‘);
    if strcmp(s,quitnow)
        break;
    end

    % Convert the input string to a vector of numerical values and verify
    % the number of inputs.
    v = str2num(s);
    if numel(v) ~= 7
        disp(‘Incorrect number of inputs.‘)
        continue
    end

    p=twomodegauss(v(1),v(2),v(3),v(4),v(5),v(6),v(7));
    % Start a new figure and scale the axes. Specifying only xlim leaves
    % ylim on auto.
    figure, plot(p)
    xlim([0 255])
end
由于直方图均衡化在本例中出现的问题,主要是因为在原始图像0级灰度附近像素过于集中,因此,合理的方法是修改本图像的直方图,使其不再有此特性。下图显示了某个函数的图形(用manualhist程序得到),保留了原始直方图的一般形状,并且在图像较暗区域的灰度级有较为平滑的过渡。程序的输出p由256个等间隔点组成,并且是希望的特定直方图。可以看到,规定的直方图表现了较原始直方图更合适的变化。这正是图像增强中取得有意义改进的全部要求。

在此基础上,一幅具有规定直方图的图像由下列命令生成:
>> g=histeq(f,p);
>> subplot(221);imshow(f);xlabel(‘(a)‘);subplot(222);imhist(f);xlabel(‘(b)‘);
>> subplot(223);imshow(g);xlabel(‘(c)‘);subplot(224);imhist(g);xlabel(‘(d)‘)

图(c)显示了直方图均衡化的改进结果。图(d)的直方图最突出的特性是:低端移动到接近灰度级较亮的区域,从而接近规定的形状。但是注意到,这里的向右移动并不像直方图均衡化中的结果那样移动得那么多,那样得到的增强效果是很差的。
3.3.4 函数adapthisteq
这个工具箱函数执行所谓的对比度受限的自适应直方图均衡(Contrast-Limited Adaptive Histogram Equalization, CLAHE)。前两节讨论的方法对整个图像进行操作,此处的方法与前两节不同,这个方法是由用直方图规定化方法处理图像的小区域(称为小片)组成。然后用双线性内插法将相邻小片组合起来以消除人工引入的边界效应。特别是可以限制均匀亮度区域的对比度,以免放大噪声。adapthisteq函数的语法如下:
g = adapthisteq(f,param1,val1,param2,val2,...)
其中,f是输入图像,g是输出图像,param/val是下表中所列的内容
| ’NumTiles‘ |
根据行和列[r c]指定小片数的正整数的两元素向量。r和c至少是2,小片总数是r*c,默认值是[8 8] |
| ‘ClipLimit‘ |
范围[0 1]内的标量,指定了对比度增强限制。值越高,对比度也越高。默认值是0.01 |
| ‘NBins’ |
正整数标量,为建立对比度增强变换而使用的直方图指定堆栈数目。值越高,动态范围越大,同时要付出降低处理速度的代价。默认值是256 |
| ‘Range’ |
指定输出图像数据范围的字符串: ‘original’—将范围限制为原图像范围[min(f(:)) max(f(:))] |
| ‘Distribution‘ |
字符串,用于指定图像小片所需的直方图形状:
‘uniform’—平坦的直方图(默认值)
‘rayleigh’—钟形直方图
‘exponential’—曲线直方图 |
| ‘Alpha‘ |
用于瑞利分布和指数分布的非负标量,默认值是0.4 |
例3.7 adapthisteq函数的使用
下图(a)是原始图像,图(b)是使用函数adapthisteq全部默认设置之后的结果,虽然结果显示的细节有所增加,但图像的重要部分仍然较暗;图(c)显示了将小片大小增加到[25 25]后的结果,清晰度略有增加,但并未出现新的细节;图(d)增加对比度限制到0.05,与前两个结果对比,这幅图像在细节方面明显增强。通过比较图(d)和之前直方图匹配方法得到的图(c),可以十分清楚的看到局部增强法相对于全局增强法的优势。
>> g1=adapthisteq(f);
>> g2=adapthisteq(f,‘NumTiles‘,[25 25]);
>> g3=adapthisteq(f,‘NumTiles‘,[25 25],‘ClipLimit‘,0.05);
>> subplot(221);imshow(f);xlabel(‘(a)‘);subplot(222);imshow(g1);xlabel(‘(b)‘);
>> subplot(223);imshow(g2);xlabel(‘(c)‘);subplot(224);imshow(g3);xlabel(‘(d)‘);

数字图像处理的Matlab实现(4)—灰度变换与空间滤波
标签:imei 表达式 语法 结果 正整数 核心 space mbr alpha
原文地址:https://www.cnblogs.com/SweetZxl/p/9219650.html


