标签:glob col pst cal form ide 2.2.3 direct alt
tensorboard是TF提供的一个可视化的工具
1.tensorboard可视化的数据来源?
将tensorflow程序运行过程中输出的日志文件进行可视化展示.
1.1 tensorflow怎样输出日志文件呢?
tf.summary.FileWriter
The FileWriter class provides a mechanism to create an event file in a given directory and add summaries and events to it. The class updates the file contents asynchronously. This allows a trainin
g program to call methods to add data to the file directly from the training loop, without slowing down training.
FileWriter类使tensorboard支持异步更新程序运行状态;即tensorflow程序在在训练过程中,tensorboard可以实时的显示数据的变化
tb_ex1.py---简单的日志文件的tensorboard可视化程序
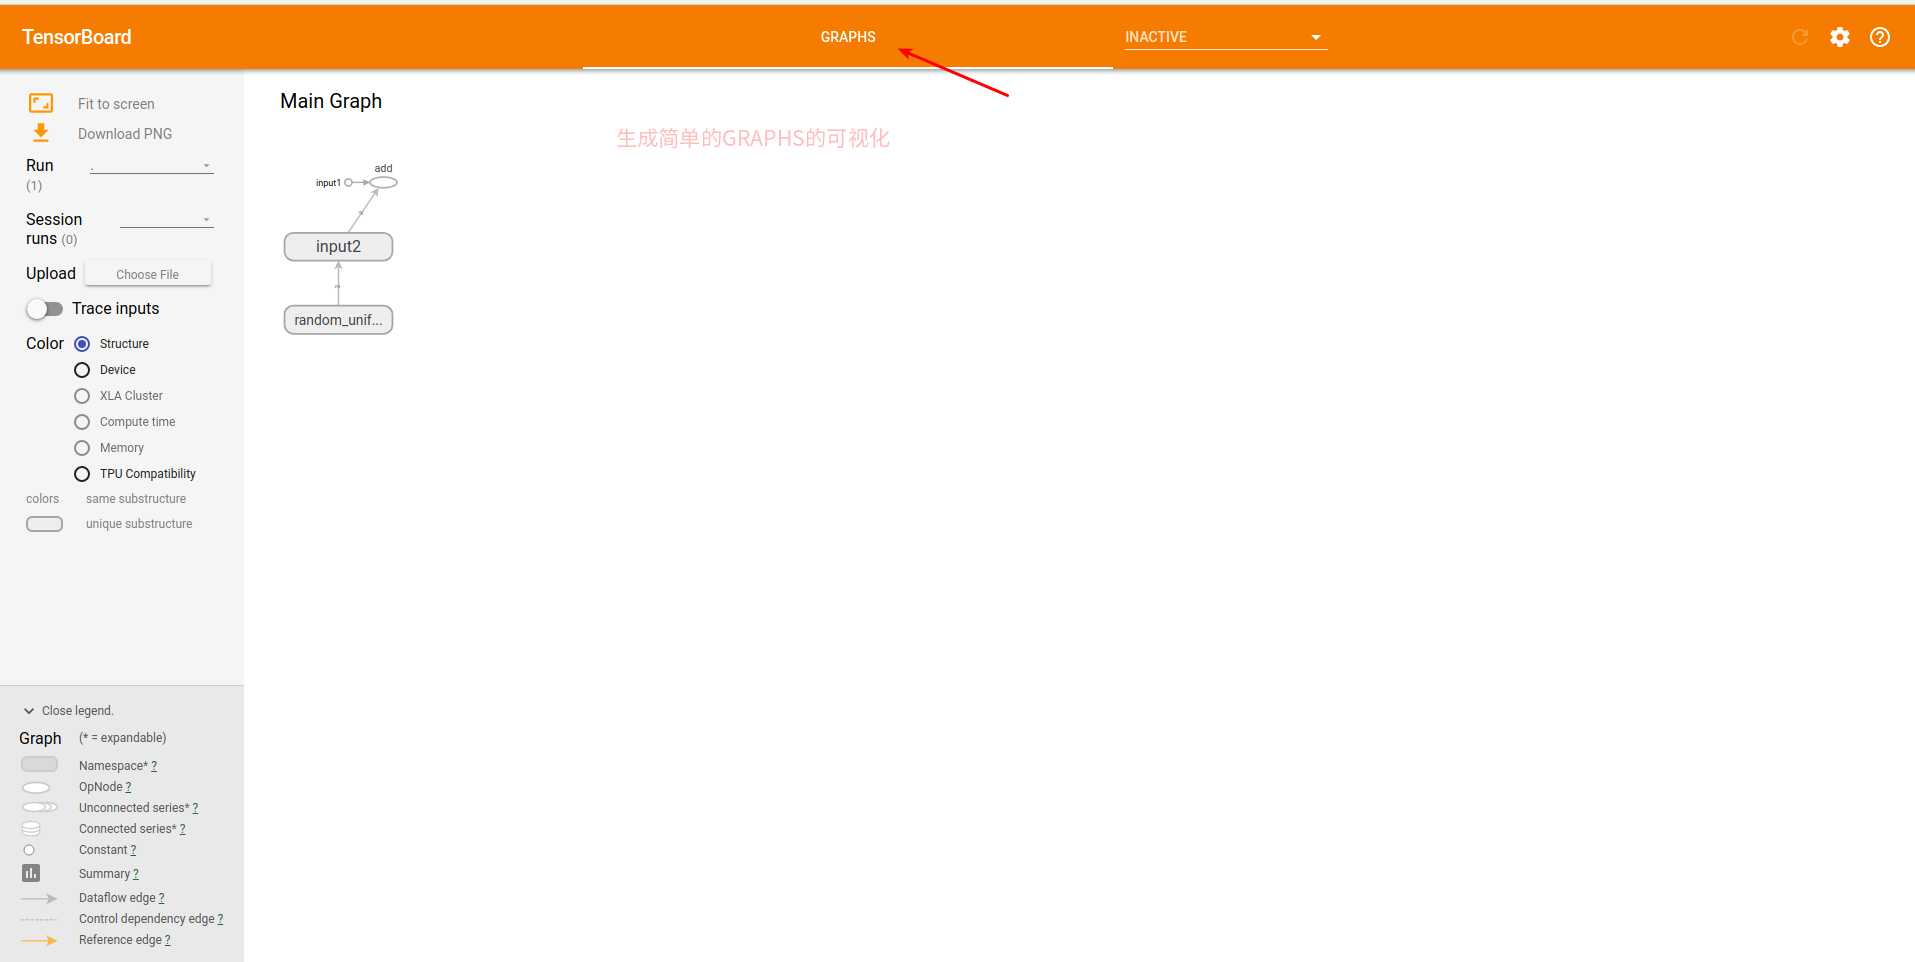
2.tensorboard可以将哪些数据进行可视化?
2.1 神经网络结构(graph)的可视化
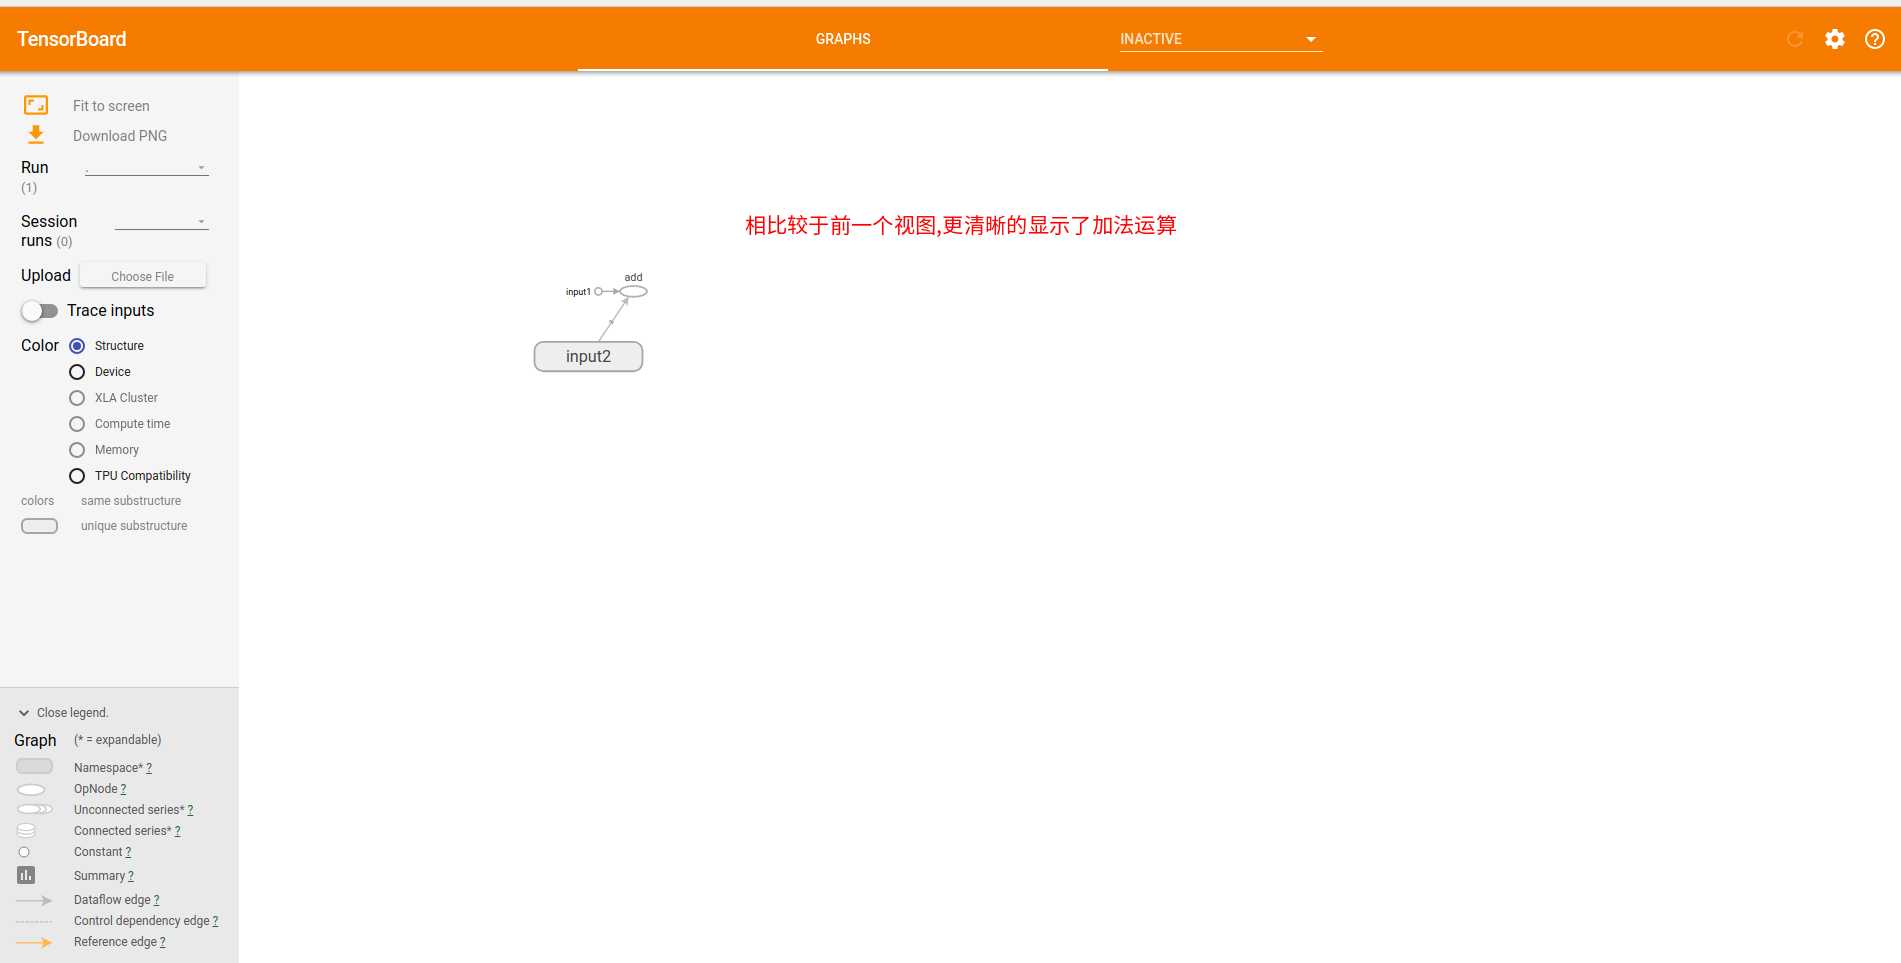
利用命名空间使神经网络模型的结构更加清晰
tb_ex2.py---通过命名空间,使计算图的结构更加简洁
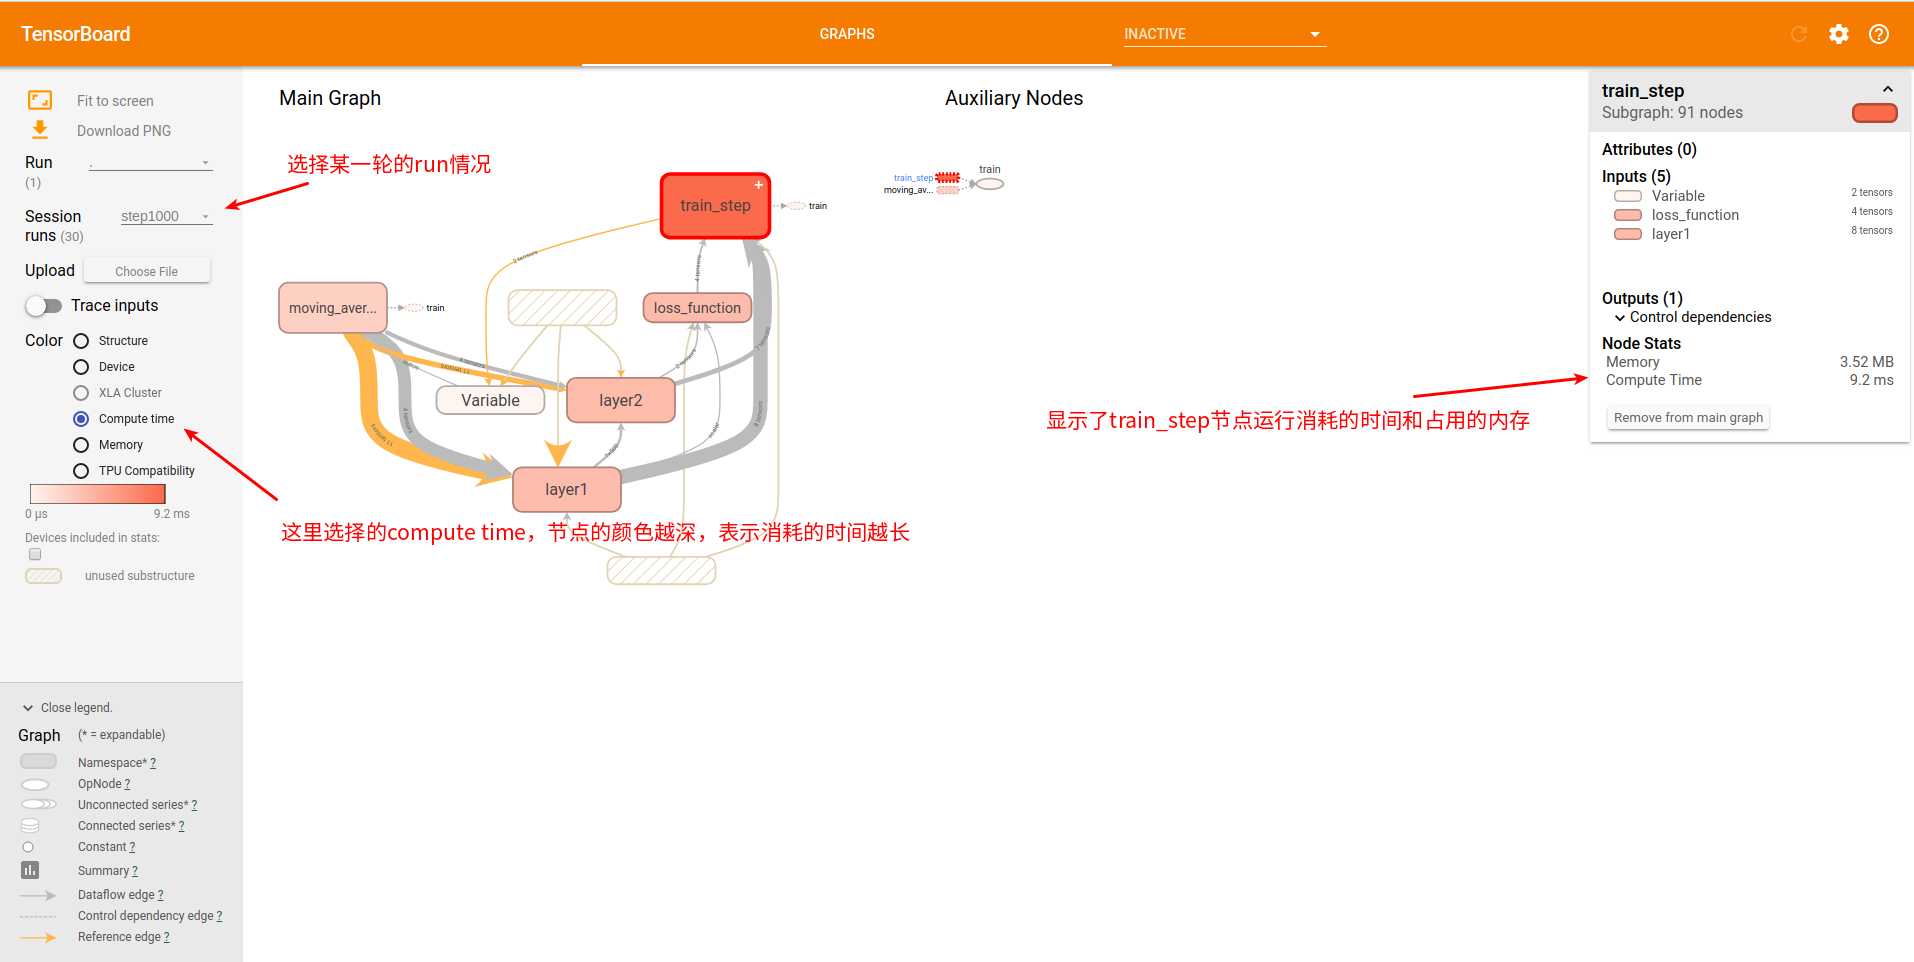
2.2 TF计算节点的运行时间和内存占用可视化
2.2.1 tf.RunOptions()#配置运行时需要记录的信息的protocolmessage
2.2.2 tf.RunMetadata()#运行时记录运行信息的protocolmessage
2.2.3 sess.run(options=run_options, run_metadata=run_metadata)
run(
fetches,
feed_dict=None,
options=None,
run_metadata=None
)
The optional options argument expects a [RunOptions] proto. The options allow controlling the behavior of this particular step (e.g. turning tracing on).
The optional run_metadata argument expects a [RunMetadata] proto. When appropriate, the non-Tensor output of this step will be collected there. For example, when users turn on tracing in options,
the profiled info will be collected into this argument and passed back.
将配置信息和记录运行信息的protocol buffer传入 运行的过程,从而记录运行时每一个节点的时间,空间的开销信息
2.2.4 FileWriter.add_run_metadata(run_metadata,)#将节点运行时的信息写入日志文件
add_run_metadata(
run_metadata,
tag,
global_step=None
)
Adds a metadata information for a single session.run() call.
Args:
run_metadata: A RunMetadata protobuf object.
tag: The tag name for this metadata.
global_step: Number. Optional global step counter to record with the StepStats.
以mnist为例,展示节点的运行时间和内存占用情况
mnist_inference.py
mnist_train.py
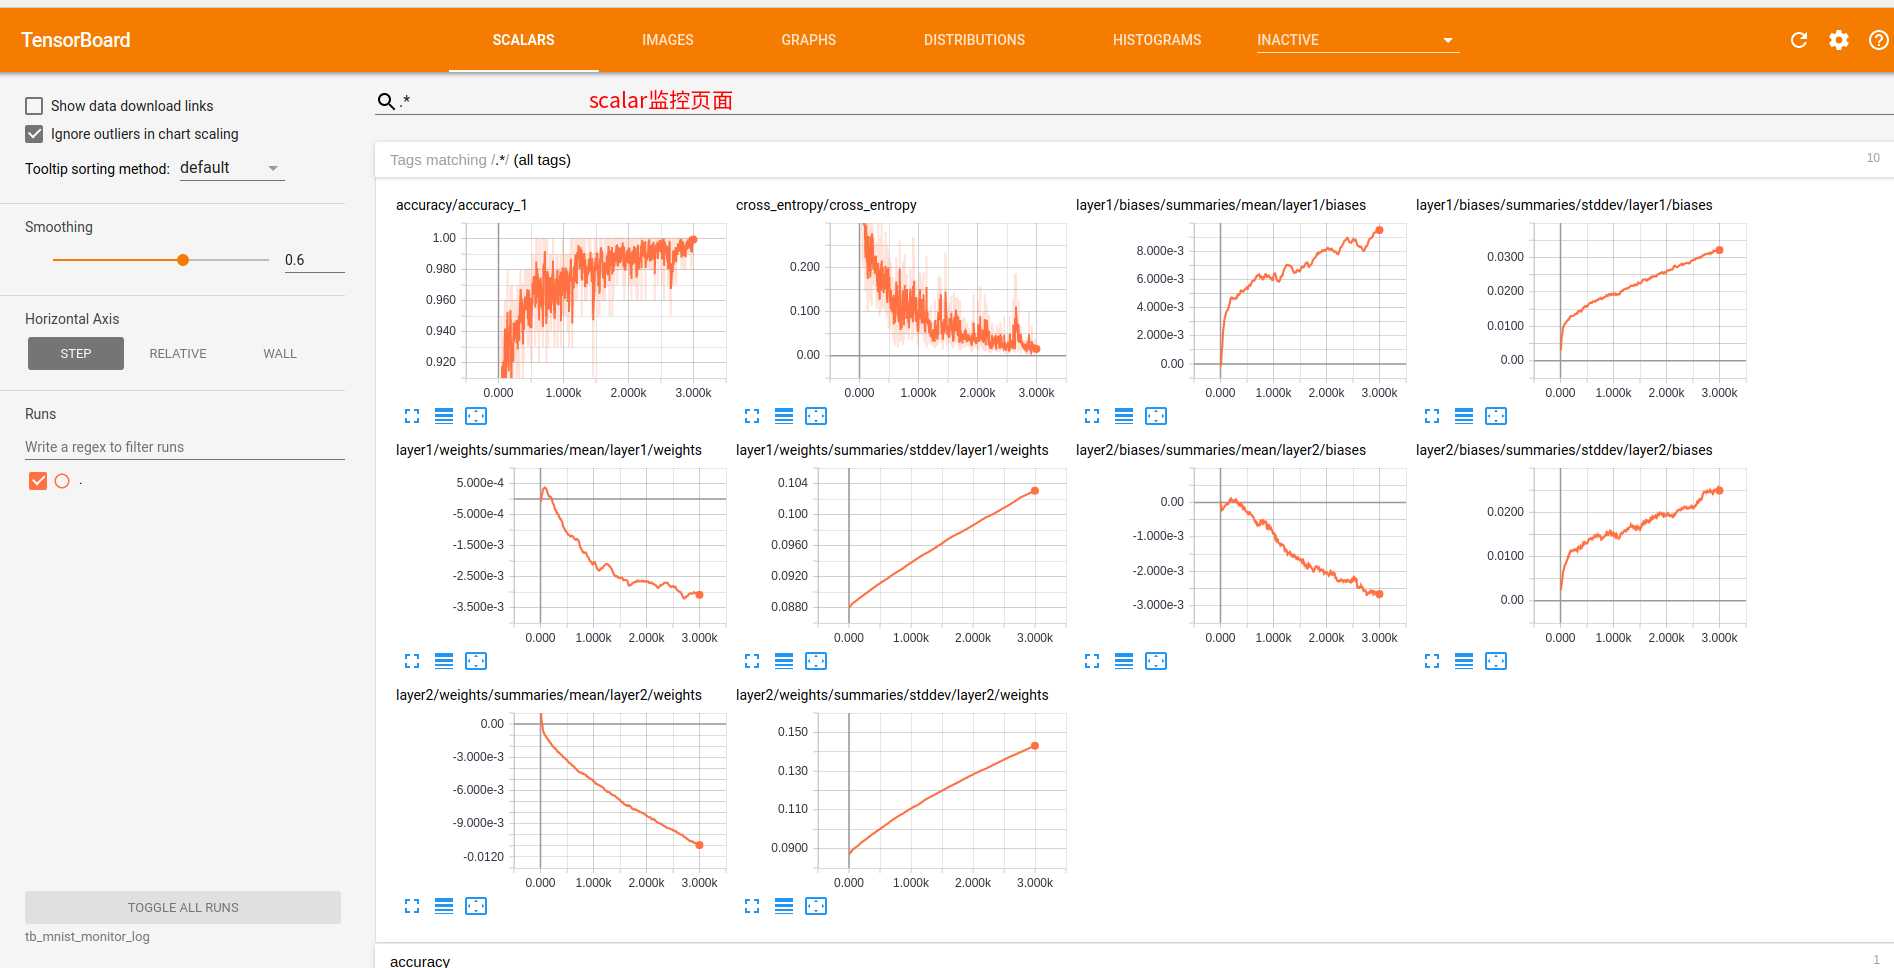
2.3 变量指标可视化
2.1和2.2主要是介绍了tensorboard的GRAPHS视图,来显示TF的NN结构和graph上的节点信息.TB还有SCALARS,IMAGES,AUDIO,DISTRIBUTIONS,HISTOGRAM和TEXT六个界面来可视化其他监控指标.
2.3.1 tf.summary.scalar TF中标量(scalar)监控数据随着训练(迭代)轮数的变化趋势
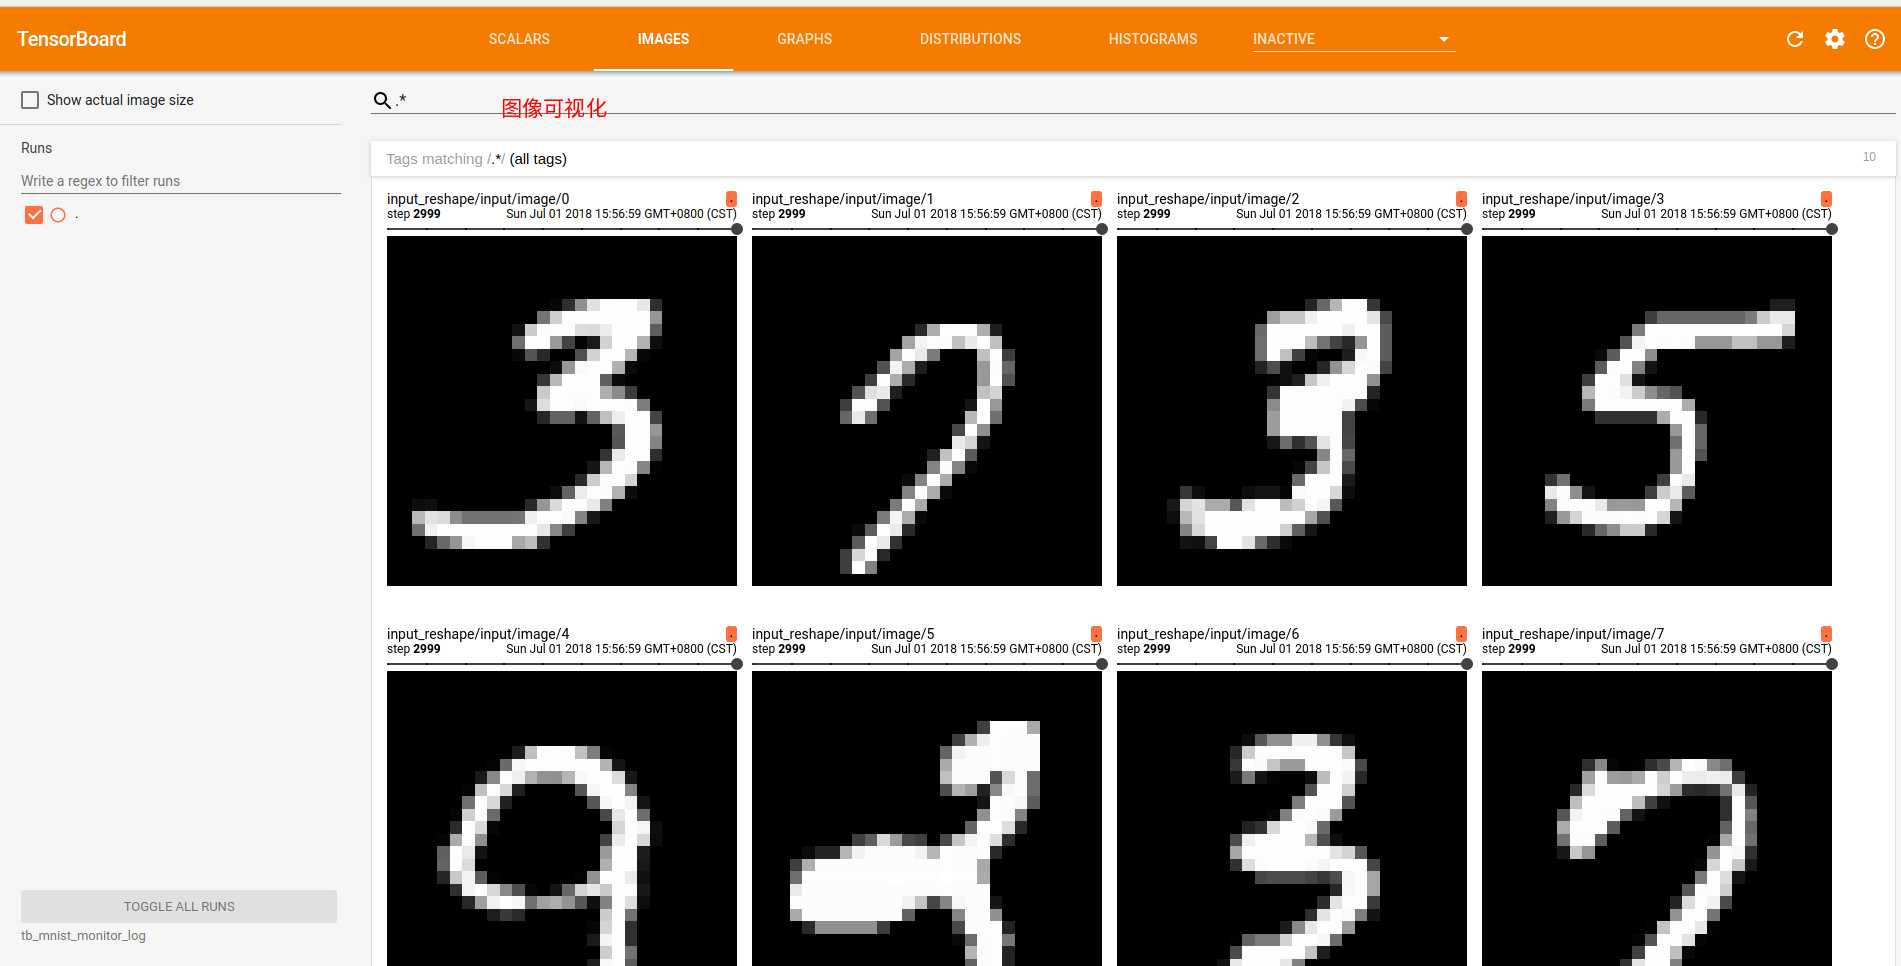
2.3.2 tf.summary.image TF中使用的图片数据的显示.一般用于可视化当前使用的训练或测试图片
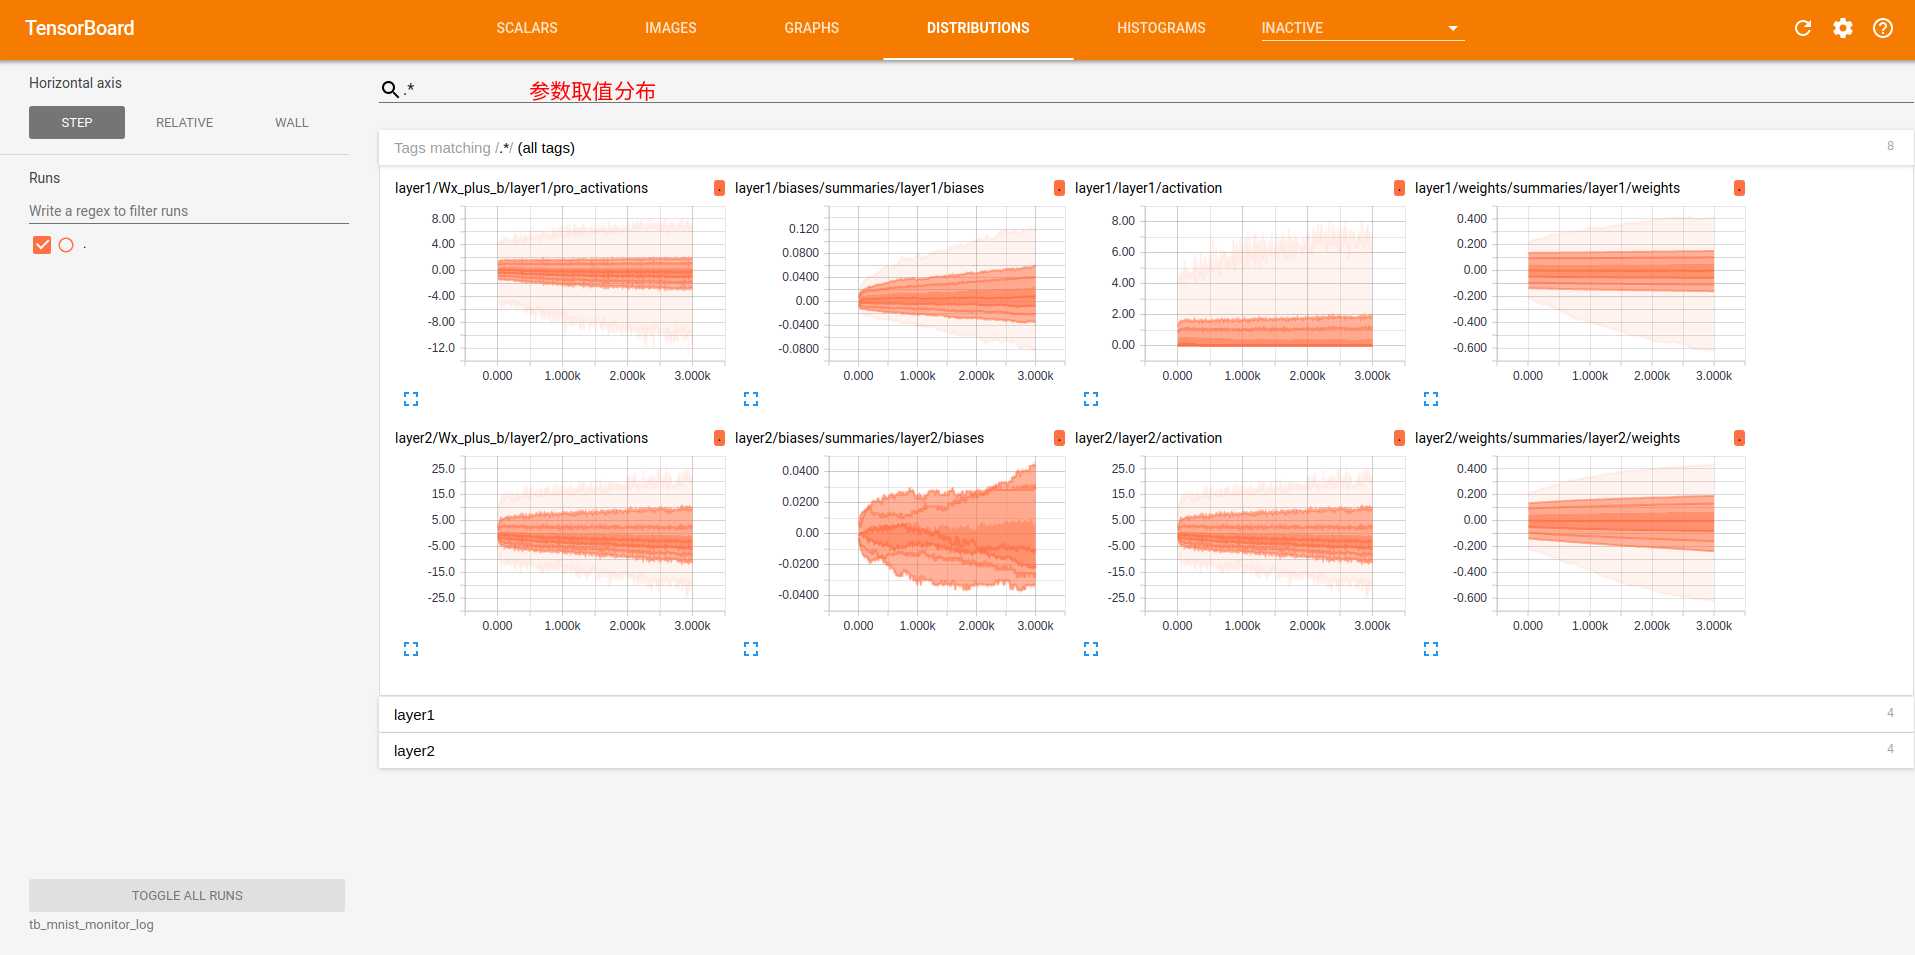
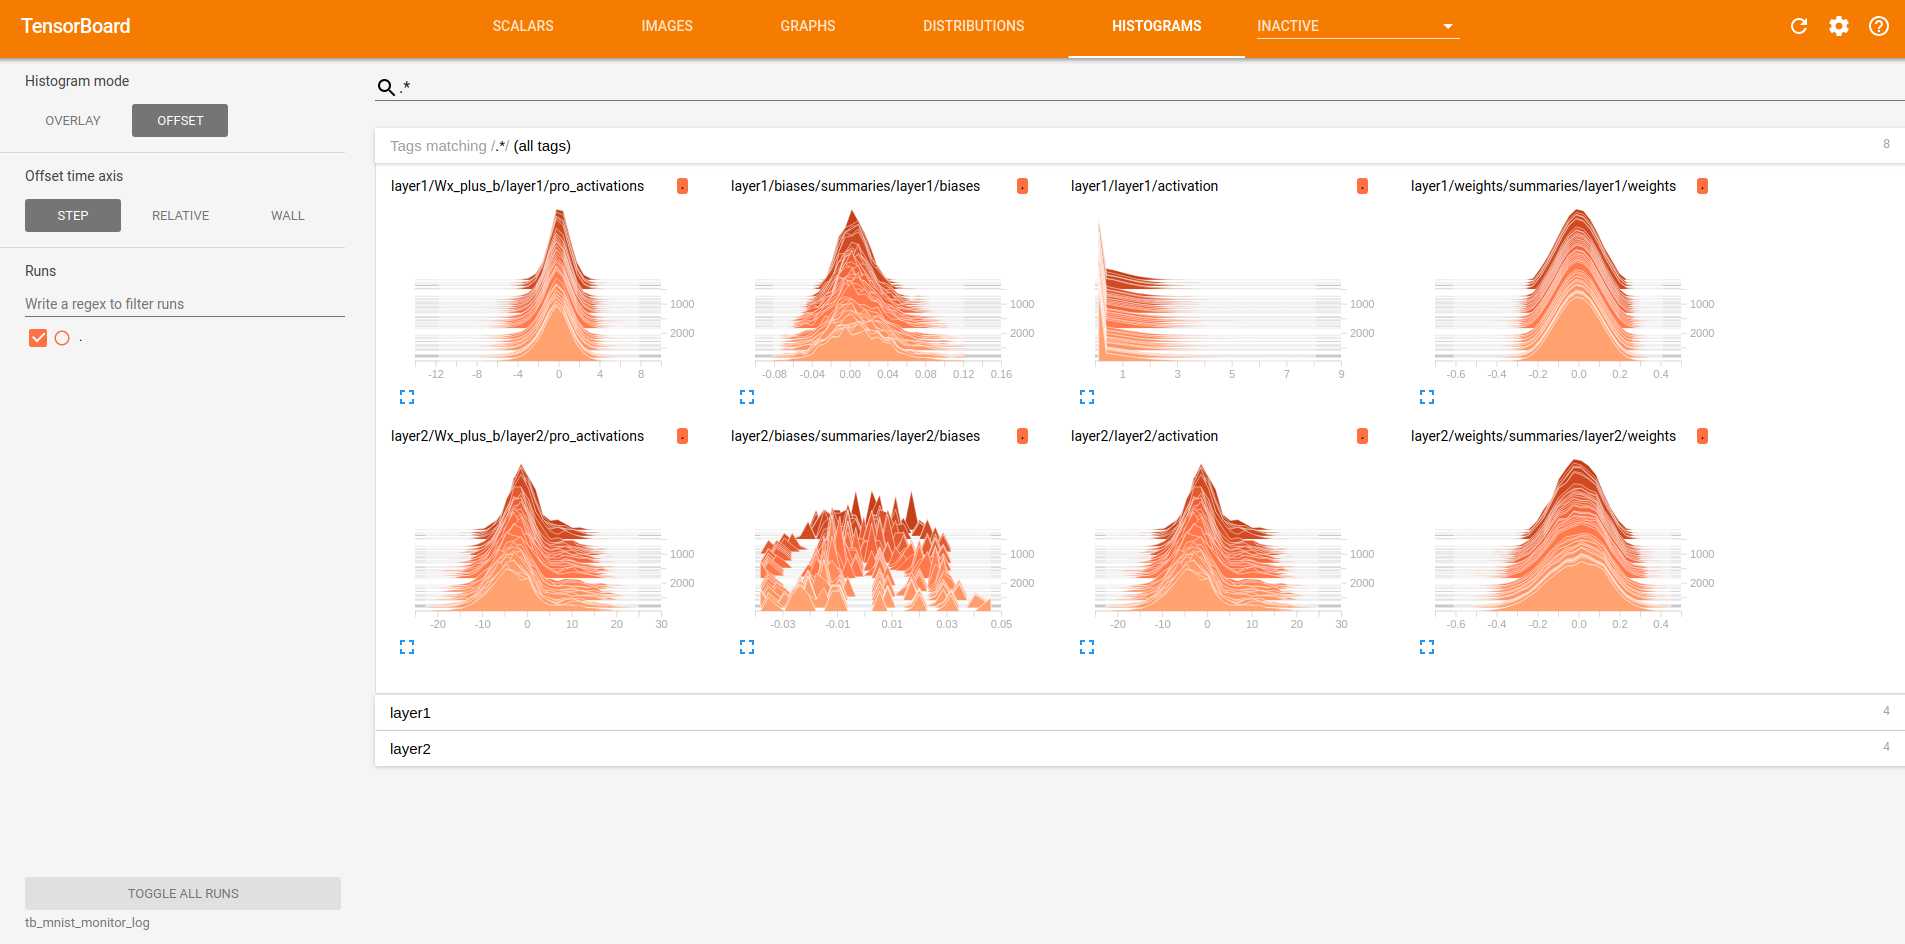
2.3.3 tf.summary.histogram TF中tensor取值分布的监控数据随着训练(迭代)轮数的变化趋势
2.3.4 tf.summary.audio TF中使用的音频数据
2.3.5 tf.summary.text TF中使用的文本数据
tb_mnist_monitor.py---对不同变量指标的监控可视化
标签:glob col pst cal form ide 2.2.3 direct alt
原文地址:https://www.cnblogs.com/black-mamba/p/9281787.html