标签:save otl title bin imp 表示 turn 数据源 代码
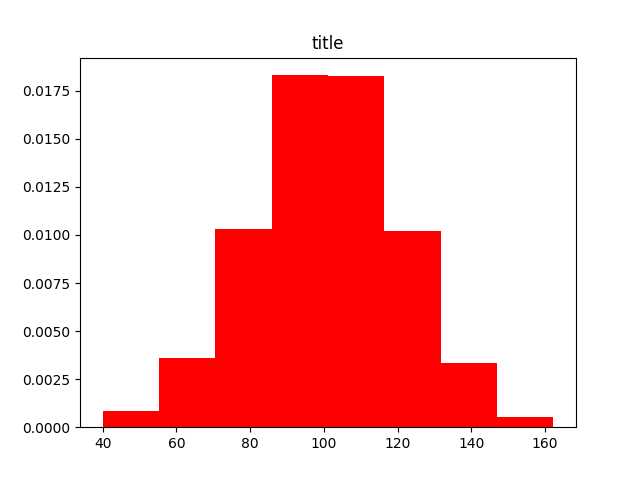
直方图特点
由一系列高度不等的纵向条形组成,表示数据分布情况
例如年级同学身高分布
注意与条形图的区别
示例代码:
import osimport numpy as np
import matplotlib.pyplot as plt


basedir = os.path.dirname(os.path.abspath(__file__))
resultdir = os.path.join(basedir, ‘result‘)


def create_hist(data,bins=8,color=‘red‘,normad=True):
    ‘‘‘

    :param data: 数据源
    :param bins: 直方图的臂数,默认5条
    :param color: 颜色,默认为红色
    :param normad: 是否对数据进行标准化,默认标准化
    :return:
    ‘‘‘
    plt.hist(data,bins=bins,color=color,normed=normad)
    plt.title(‘title‘)
    plt.savefig(os.path.join(resultdir, ‘test.png‘))


mu = 100
singma = 20
x = mu + singma*np.random.randn(1000)
create_hist(x)
运行结果:

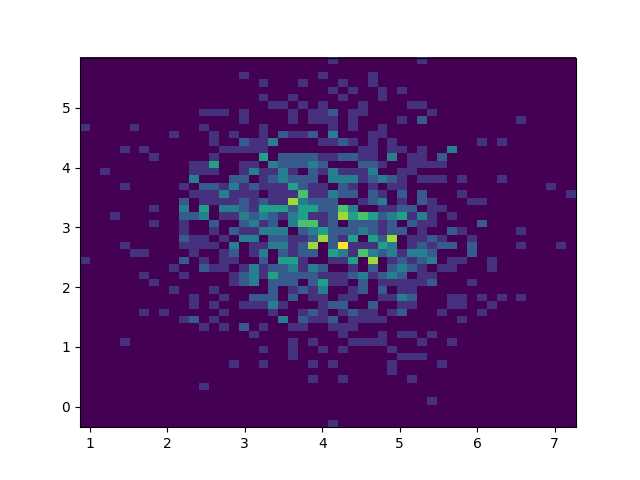
双变量直方图用颜色的深浅来表示频率的大小
示例代码:
import os
import numpy as np
import matplotlib.pyplot as plt


basedir = os.path.dirname(os.path.abspath(__file__))
resultdir = os.path.join(basedir, ‘result‘)


x = np.random.randn(1000)+4
y = np.random.randn(1000)+3

plt.hist2d(x,y,bins=50)
plt.savefig(os.path.join(resultdir, ‘test.png‘))
运行结果:

标签:save otl title bin imp 表示 turn 数据源 代码
原文地址:https://www.cnblogs.com/Keys819/p/9307327.html