标签:http os ar 数据 sp 2014 c on log
> dataset = matrix(c(1,2,
+ 1.2,2,
+ 8,9,
+ 0.9,1.8,
+ 7,10,
+ 8.8,9.2), nrow=6, byrow=T)
> dataset
     [,1] [,2]
[1,]  1.0  2.0
[2,]  1.2  2.0
[3,]  8.0  9.0
[4,]  0.9  1.8
[5,]  7.0 10.0
[6,]  8.8  9.2
> d = dist(dataset)
> d
           1          2          3          4          5
2  0.2000000
3  9.8994949  9.7590983
4  0.2236068  0.3605551 10.1118742
5 10.0000000  9.8812955  1.4142136 10.2200783
6 10.6150836 10.4690019  0.8246211 10.8245092  1.9697716
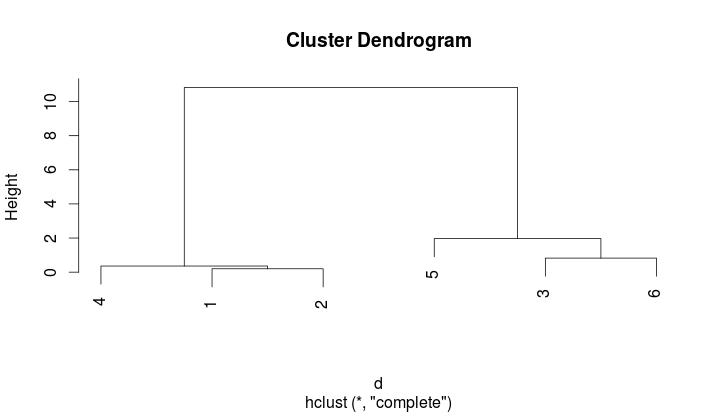
> hclust(d, method = "complete")

Call:
hclust(d = d, method = "complete")

Cluster method   : complete
Distance         : euclidean
Number of objects: 6

> hc = hclust(d, method = "complete")
> plot(hc)

> democut<-cutree(hc,k=2)
> democut
[1] 1 1 2 1 2 2
http://www.r-tutor.com/gpu-computing/clustering/hierarchical-cluster-analysis
http://stat.ethz.ch/R-manual/R-devel/library/stats/html/hclust.html
http://ecology.msu.montana.edu/labdsv/R/labs/lab13/lab13.html
标签:http os ar 数据 sp 2014 c on log
原文地址:http://my.oschina.net/letiantian/blog/324395