In matlab you can view a grayscale image with:
imshow(im)Which for my image im shows:
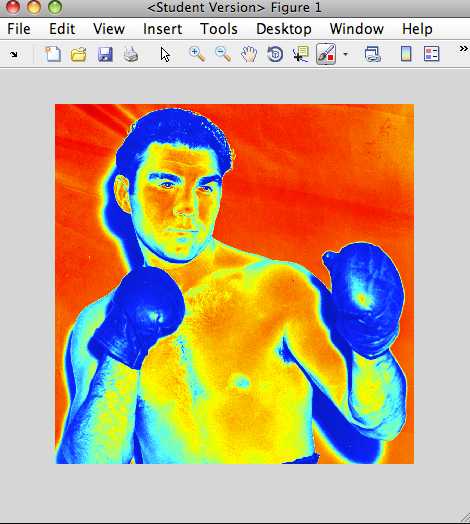
And you can also view this grayscale image using pseudocolors from a given colormap with something like:
imshow(im,‘Colormap‘,jet(255))Which shows:
But it’s not obvious how to use the colormap to actually retrieve the RGB values we see in the plot. Here’s a simple way to convert a grayscale image to a red, green, blue color image using a given colormap:
rgb = ind2rgb(gray2ind(im,255),jet(255));Replace the 255 with the number of colors in your grayscale image. If you don’t know the number of colors in your grayscale image you can easily find out with:
n = size(unique(reshape(im,size(im,1)*size(im,2),size(im,3))),1);It’s a little overly complicated to handle if im is already a RGB image.
If you don’t mind if the rgb image comes out as a uint8 rather than double you can use the following which is an order of magnitude faster:
rgb = label2rgb(gray2ind(im,255),jet(255));Then with your colormaped image stored in rgb you can do anything you normally would with a rgb color image, like view it:
imshow(rgb);which shows the same as above:
Possible function names include real2rgb, gray2rgb.
Tags: color, grayscale, image processing, matlab
What you are asking is to perform a pseudo colouring of an image. Doing this in MATLAB is actually quite easy. You can use the grayscale intensities as an index into a colour map, and each intensity would generate a unique colour. First, what you need to do is create a colour map that is 256 elements long, then use ind2rgb to create your colour image given the grayscale intensities / indices of your image.
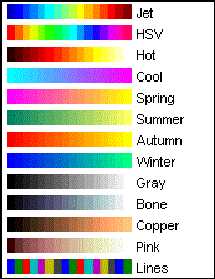
There are many different colour maps that are available to you in MATLAB. Here are the current available colour maps in MATLAB without the recently added Parula colour map that was introduced in R2014:

How the colour maps work is that lower indices / grayscale values have colours that move toward the left side of the spectrum and higher indices / grayscale values have colours that move toward the right side of the spectrum.
If you want to create a colour map with 256 elements, you simply use any one of those colour maps as a function and specify 256 as the input parameter to generate a 256 element colour map for you. For example, if you wanted to use the HSV colour map, you would do this in MATLAB:
cmap = hsv(256);Now, given your grayscale image in your MATLAB workspace is stored in imageArray, simply use ind2rgb this way:
colourArray = ind2rgb(double(imageArray)+1, cmap);The first argument is the grayscale image you want to pseudocolour, and the second input is the colour map produced by any one of MATLAB‘s colour mapping functions. colourArray will contain your pseudo coloured image. Take note that we offset the grayscale image by 1 and also cast to double. The reason for this is because MATLAB is a 1-indexed programming language, so we have to start indexing into arrays / matrices starting at 1. Because your intensities range from [0,255], and we want to use this to index into the colour map, we must make this go from [1,256] to allow the indexing. In addition, you are most likely using uint8 images, and so adding 1 to a uint8 will simply saturate any values that are already at 255 to 255. We won‘t be able to go to 256. Therefore, you need to cast the image temporarily to double so that we can increase the precision of the image and then add 1 to allow the image to go to 256 if merited.
Here‘s an example using the cameraman.tif image that‘s part of the image processing toolbox. This is what it looks like:

So we can load in that image in MATLAB like so:
imageArray = imread(‘cameraman.tif‘);Next, we can use the above image, generate a HSV colour map then pseudocolour the image:
cmap = hsv(256);
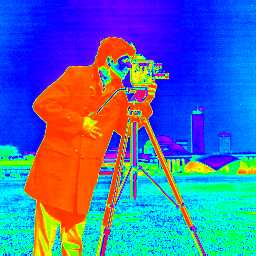
colourArray = ind2rgb(imageArray+1, cmap);
We get:

Take note that you don‘t have to use any of the colour maps that MATLAB provides. In fact, you can create your own colour map. All you have to do is create a 256 x 3 matrix where each column denotes the proportion of red (first column), green (second column) and blue (third column) values per intensity. Therefore, the first row gives you the colour that is mapped to intensity 0, the second row gives you the colour that is mapped to intensity 1 and so on. Also, you need to make sure that the intensities are floating-point and range from [0,1]. For example, these are the first 10 rows of the HSV colour map generated above:
>> cmap(1:10,:)

ans =1.0000         0         01.0000    0.0234         01.0000    0.0469         01.0000    0.0703         01.0000    0.0938         01.0000    0.1172         01.0000    0.1406         01.0000    0.1641         01.0000    0.1875         01.0000    0.2109         0
You can then use this custom colour map into ind2rgb to pseudocolour your image.
Good luck and have fun!
