标签:性能 version 钉钉报警 x86 ranch systemd 钉钉 src 通过
1.环境2.下载安装包
https://prometheus.io/download/ (需要的安装包都可以下载)
wget https://github.com/prometheus/prometheus/releases/download/v2.3.2/prometheus-2.3.2.linux-amd64.tar.gz
服务端(监控server)
3.安装prometheus
部署到/usr/local/目录
promethus不用编译安装,解压目录中有配置文件与启动文件
tar -zxvf prometheus-2.3.2.linux-amd64.tar.gz -C /usr/local/
cd /usr/local/ && mv prometheus-2.3.2.linux-amd64/ prometheus
验证
[root@prometheus local]# cd prometheus/
[root@prometheus prometheus]# ./prometheus --version
prometheus, version 2.3.2 (branch: HEAD, revision: 71af5e29e815795e9dd14742ee7725682fa14b7b)
build user: root@5258e0bd9cc1
build date: 20180712-14:02:52
go version: go1.10.3
备份配置文件并配置
cp prometheus.yml prometheus.yml-bak
global:
scrape_interval: 15s # Set the scrape interval to every 15 seconds. Default is every 1 minute.
evaluation_interval: 15s # Evaluate rules every 15 seconds. The default is every 1 minute.
alerting:
alertmanagers:
rule_files:
scrape_configs:
job=<job_name> to any timeseries scraped from this config.job_name: ‘prometheus‘
static_configs:
添加需要监控的服务器IP和端口
启动(后台启动)
./prometheus --config.file=prometheus.yml &
然后我们可以访问 http://<服务器IP地址>:9090,验证Prometheus是否已安装成功,web显示应该如下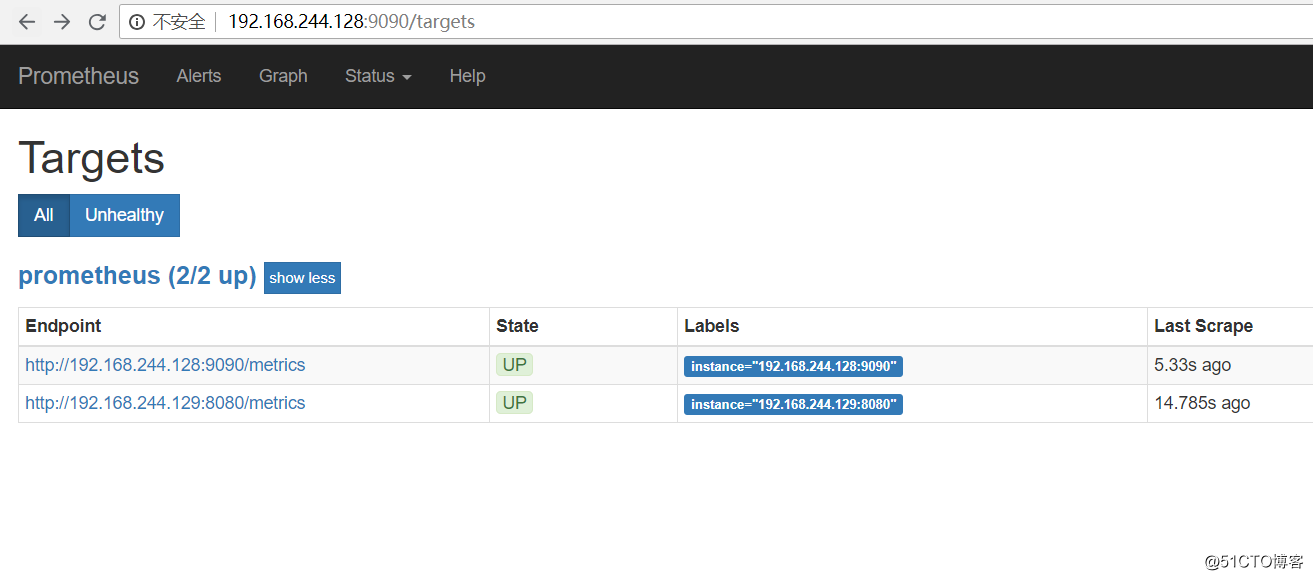
通过点击下拉栏选取指标,点击”Excute” 我们能够看到Prometheus的性能指标。
点击”status”可以查看相关状态。
4.node_exporter安装
wget https://github.com/prometheus/node_exporter/releases/download/v0.16.0/node_exporter-0.16.0.linux-amd64.tar.gz
解压并安装
tar xf node_exporter-0.16.0.linux-amd64.tar.gz C /usr/local/
cd /usr/local/ && mv mv node_exporter-0.16.0 node_exporter
cd node_exporter/ && ./node_exporter &
返回一大堆指标
5.grafana安装
wget https://s3-us-west-2.amazonaws.com/grafana-releases/release/grafana-5.2.3-1.x86_64.rpm
sudo yum localinstall grafana-5.2.3-1.x86_64.rpm
服务端图像呈现组件安装
yum install fontconfig freetype* urw-fonts -y
开启系统默认启动
systemctl enable grafana-server
启动服务
systemctl start grafana-server
查看服务是否正常启动
systemctl status grafana-server
[root@prometheus ~]# systemctl status grafana-server
● grafana-server.service - Grafana instance
Loaded: loaded (/usr/lib/systemd/system/grafana-server.service; enabled; vendor preset: disabled)
Active: active (running) since 四 2018-08-30 16:18:55 CST; 3h 23min ago
Docs: http://docs.grafana.org
Main PID: 10535 (grafana-server)
CGroup: /system.slice/grafana-server.service
└─10535 /usr/sbin/grafana-server --config=/etc/grafana/grafana.ini --pidfile=/var/run/grafana/grafana-server.pid ...
访问grafana, http://<服务器IP>:3000
默认用户名密码:admin/admin
客户端(被监控)
6.安装cAdvisor 来收集容器信息 所有节点运行以下命令来安装cAdvisor
docker run \
--volume=/:/rootfs:ro \
--volume=/var/run:/var/run:rw \
--volume=/sys:/sys:ro \
--volume=/var/lib/docker/:/var/lib/docker:ro \
--publish=8080:8080 \
--detach=true \
--name=cadvisor \
--net=host \
-v "/etc/localtime:/etc/localtime" \
google/cadvisor:latest
为grafana添加Prometheus数据源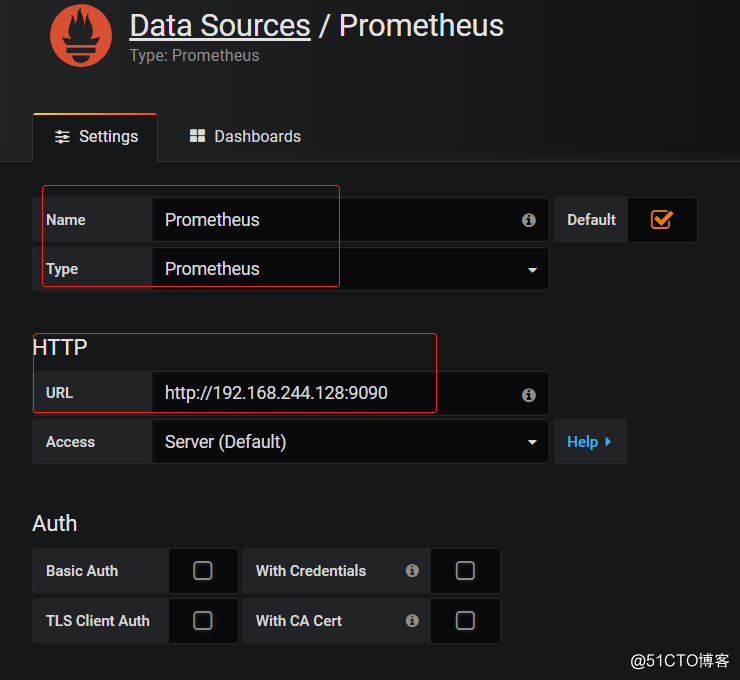
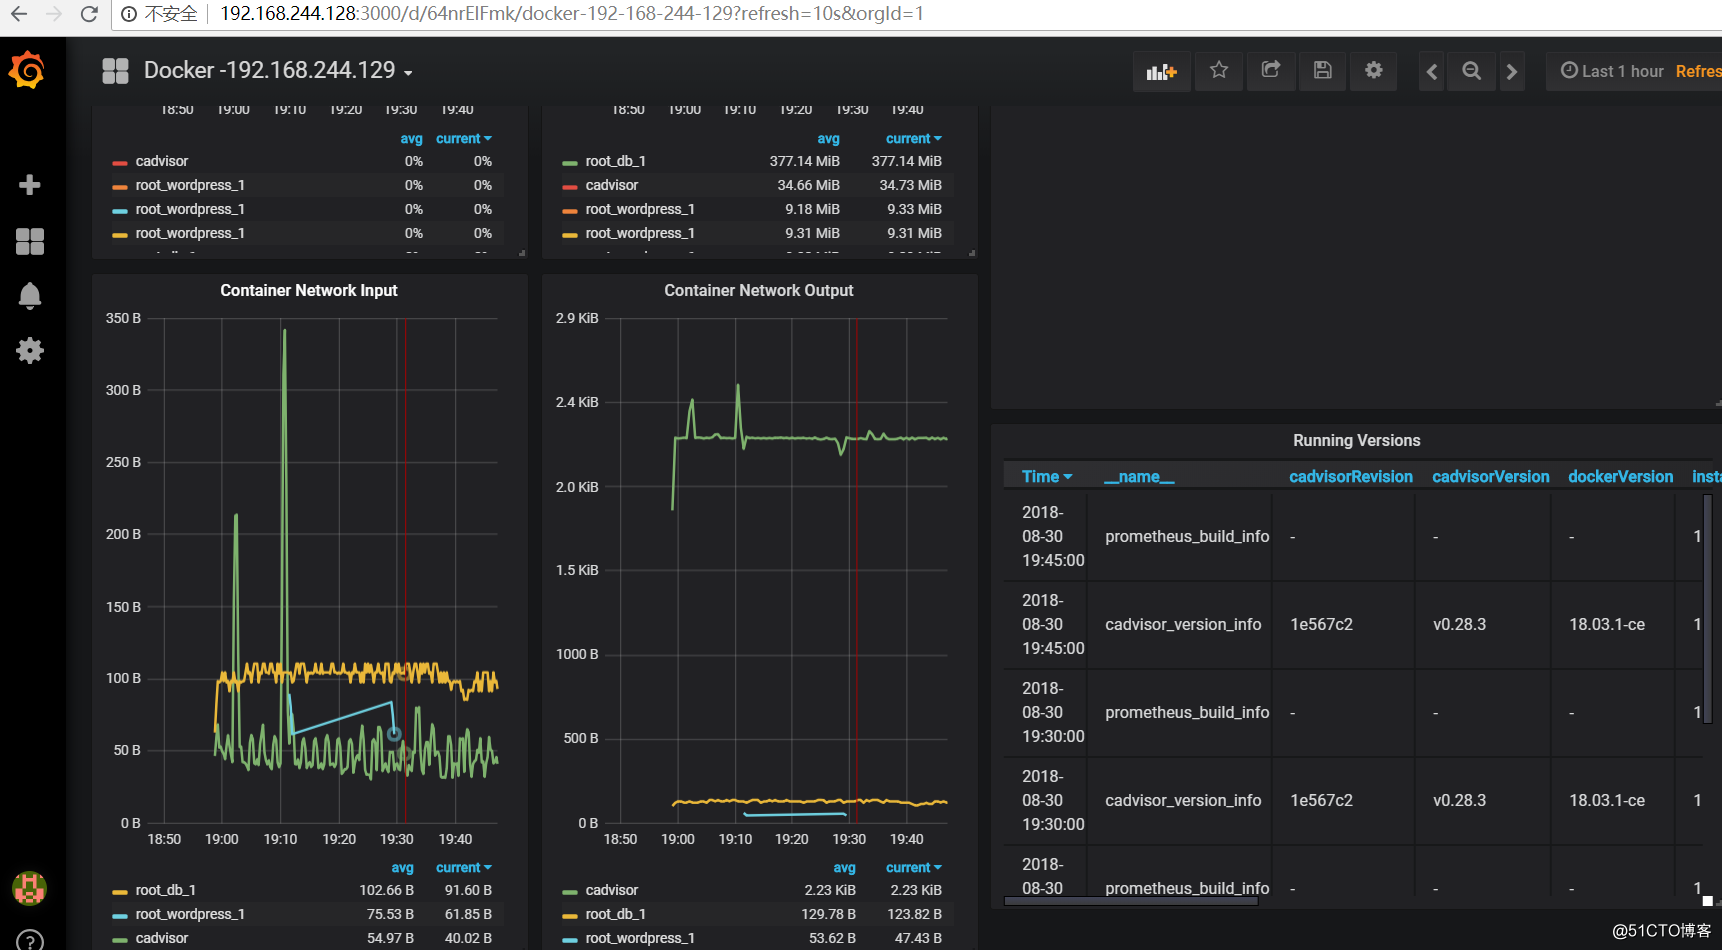
导入监控模板
https://grafana.com/dashboards?search=docker 多种docker 监控模板 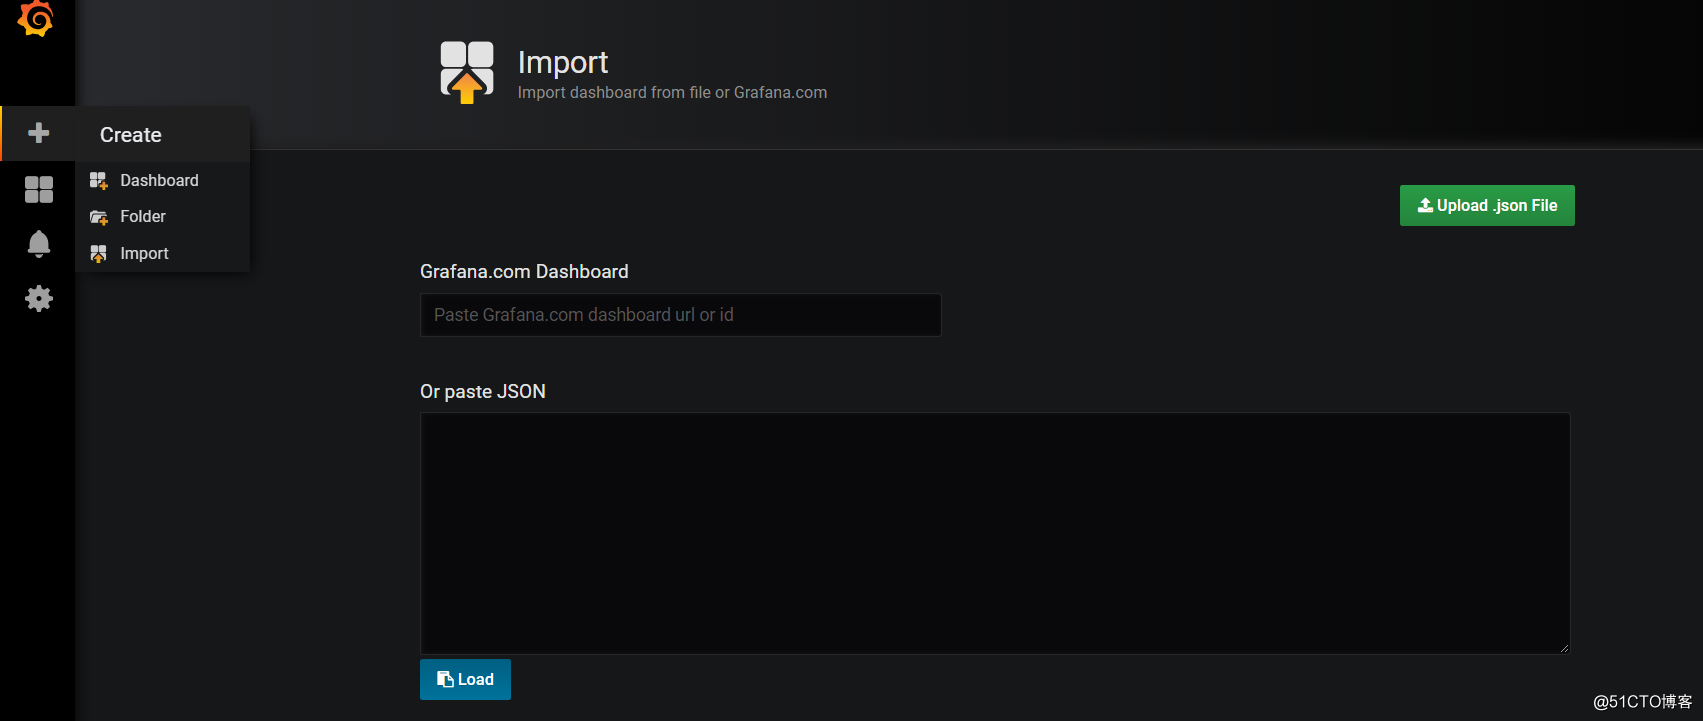
添加钉钉报警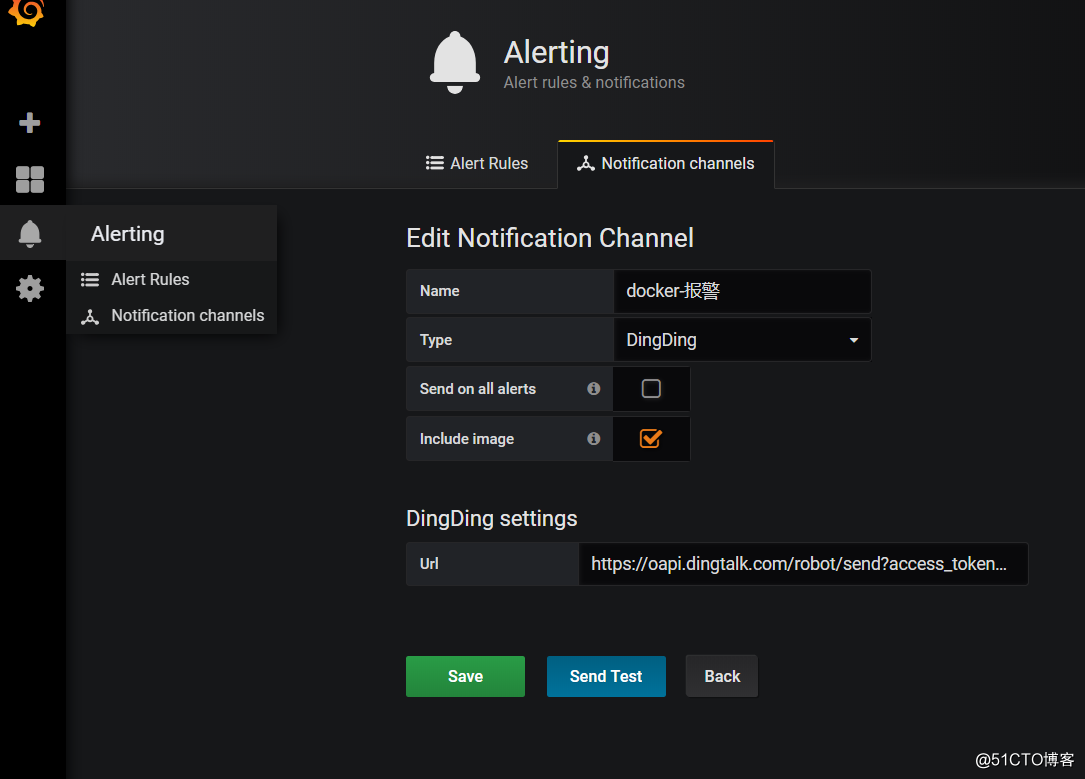
测试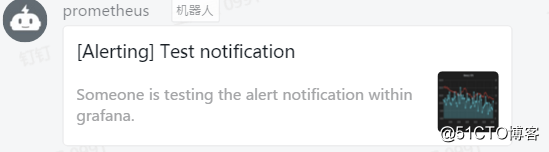
Prometheus+Grafana部署监控docker服务
标签:性能 version 钉钉报警 x86 ranch systemd 钉钉 src 通过
原文地址:http://blog.51cto.com/10158955/2167075