标签:文章 特征工程 style otl baseline cat 绘制 pen ddc
在这篇文章中,我们将探讨决策树模型的最重要参数,以及它们如何防止过度拟合和欠拟合,并且将尽可能少地进行特征工程。我们将使用来自kaggle的泰坦尼克号数据。
import pandas as pd
import numpy as np
import matplotlib as mpl
import matplotlib.pyplot as plt

data=pd.read_csv(r‘F:\wd.jupyter\datasets\train.csv‘)
data.shape
data.head()

#Checking for missing data
NAs = pd.concat([data.isnull().sum()],axis=1,keys=[‘Train‘])
NAs[NAs.sum(axis=1) > 0]
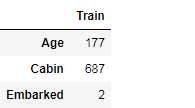
把Cabin’, ‘Name’ and ‘Ticket’移除,并且填充缺失值,并处理分类型变量。
# At this point we will drop the Cabin feature since it is missing a lot of the data
data.pop(‘Cabin‘)
data.pop(‘Name‘)
data.pop(‘Ticket‘)

#Fill the missing age values by the mean value

# Filling missing Age values with mean
data[‘Age‘] = data[‘Age‘].fillna(data[‘Age‘].mean())

#Fill the missing ‘Embarked’ values by the most frequent value

# Filling missing Embarked values with most common value
data[‘Embarked‘] = data[‘Embarked‘].fillna(data[‘Embarked‘].mode()[0])

#‘Pclass’ is a categorical feature so we convert its values to strings

data[‘Pclass‘] = data[‘Pclass‘].apply(str)

#Let’s perform a basic one hot encoding of categorical features

# Getting Dummies from all other categorical vars
for col in  data.dtypes[data.dtypes == ‘object‘].index:

    for_dummy = data.pop(col)
    data= pd.concat([data, pd.get_dummies(for_dummy, prefix=col)], axis=1)
25%用作测试集,其余的用作训练集,做基本的决策树模型
# Prepare data for training models
labels = data.pop(‘Survived‘)

#For testing, we choose to split our data to 75% train and 25% for test

from sklearn.model_selection import train_test_split

x_train, x_test, y_train, y_test = train_test_split(data, labels, test_size=0.25)

#Let’s first fit a decision tree with default parameters to get a baseline idea of the performance

from sklearn.tree import DecisionTreeClassifier

dt = DecisionTreeClassifier()

dt.fit(x_train, y_train)

用AUC作为测量尺度查看
y_pred = dt.predict(x_test)

#We will use AUC (Area Under Curve) as the evaluation metric. Our target value is binary so it’s a binary classification problem. AUC is a good way for evaluation for this type of problems.


from sklearn.metrics import roc_curve, auc

false_positive_rate, true_positive_rate, thresholds = roc_curve(y_test, y_pred)
roc_auc = auc(false_positive_rate, true_positive_rate)
roc_auc

0.7552447552447552
要调整的第一个参数是max_depth(树的深度)。 树越深,它就分裂的越多,更能捕获有关数据的信息。 我们拟合一个深度范围从1到32的决策树,并绘制训练和测试auc分数。
max_depths = np.linspace(1, 32, 32, endpoint=True)
train_results = []
test_results = []

for max_depth in max_depths:
    dt = DecisionTreeClassifier(max_depth=max_depth)
    dt.fit(x_train, y_train)
    train_pred = dt.predict(x_train)
    false_positive_rate, true_positive_rate, thresholds = roc_curve(y_train, train_pred)
    roc_auc = auc(false_positive_rate, true_positive_rate)
    # Add auc score to previous train results
    train_results.append(roc_auc)
    y_pred = dt.predict(x_test)
    false_positive_rate, true_positive_rate, thresholds = roc_curve(y_test, y_pred)
    roc_auc = auc(false_positive_rate, true_positive_rate)
    # Add auc score to previous test results
    test_results.append(roc_auc)
from matplotlib.legend_handler import HandlerLine2D
line1, = plt.plot(max_depths, train_results, ‘b‘, label=‘Train AUC‘)
line2, = plt.plot(max_depths, test_results, ‘r‘, label=‘Test AUC‘)
plt.legend(handler_map={line1: HandlerLine2D(numpoints=2)})
plt.ylabel(‘AUC score‘)
plt.xlabel(‘Tree depth‘)
plt.show()
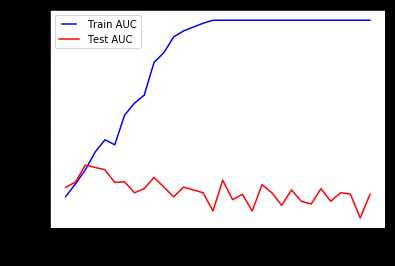
我们看到我们的模型适用于大深度值。 该树完美地预测了所有训练数据,但是,它无法很好的拟合测试数据。
min_samples_split表示拆分内部节点所需的最小样本数。 这可以在考虑每个节点处的至少一个样本,并考虑每个节点处的所有样本之间变化。 当我们增加此参数时,给与树更多的约束,因为它必须在每个节点处考虑更多样本。 在这里,我们将从10%到100%的样本中改变参数。
min_samples_splits = np.linspace(0.1, 1.0, 10, endpoint=True)
train_results = []
test_results = []
for min_samples_split in min_samples_splits:
    dt = DecisionTreeClassifier(min_samples_split=min_samples_split)
    dt.fit(x_train, y_train)
    train_pred = dt.predict(x_train)
    false_positive_rate, true_positive_rate, thresholds =    roc_curve(y_train, train_pred)
    roc_auc = auc(false_positive_rate, true_positive_rate)
    train_results.append(roc_auc)
    y_pred = dt.predict(x_test)
    false_positive_rate, true_positive_rate, thresholds = roc_curve(y_test, y_pred)
    roc_auc = auc(false_positive_rate, true_positive_rate)
    test_results.append(roc_auc)
from matplotlib.legend_handler import HandlerLine2D
line1,= plt.plot(min_samples_splits, train_results, ‘b‘, label=‘Train AUC‘)
line2,= plt.plot(min_samples_splits, test_results, ‘r‘, label=‘Test AUC‘)
plt.legend(handler_map={line1: HandlerLine2D(numpoints=2)})
plt.ylabel(‘AUC score‘)
plt.xlabel(‘min samples split‘)
plt.show()
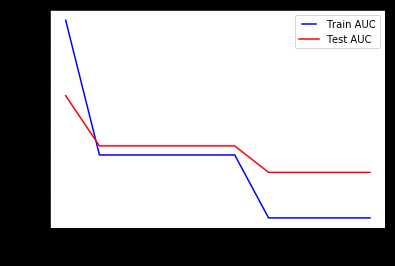
我们可以清楚地看到,当我们在每个节点上考虑100%的样本时,模型无法充分解释数据。
min_samples_leaf是叶节点所需的最小样本数。 此参数类似于min_samples_splits,但是,这描述了叶子(树的基础)处的样本的最小样本数。
min_samples_leafs = np.linspace(0.1, 0.5, 5, endpoint=True)
train_results = []
test_results = []
for min_samples_leaf in min_samples_leafs:
    dt = DecisionTreeClassifier(min_samples_leaf=min_samples_leaf)
    dt.fit(x_train, y_train)
    train_pred = dt.predict(x_train)
    false_positive_rate, true_positive_rate, thresholds = roc_curve(y_train, train_pred)
    roc_auc = auc(false_positive_rate, true_positive_rate)
    train_results.append(roc_auc)
    y_pred = dt.predict(x_test)
    false_positive_rate, true_positive_rate, thresholds = roc_curve(y_test, y_pred)
    roc_auc = auc(false_positive_rate, true_positive_rate)
    test_results.append(roc_auc)
from matplotlib.legend_handler import HandlerLine2D
line1, = plt.plot(min_samples_leafs,train_results, ‘b‘, label=‘Train AUC‘)
line2, = plt.plot(min_samples_leafs,test_results, ‘r‘, label=‘Test AUC‘)
plt.legend(handler_map={line1: HandlerLine2D(numpoints=2)})
plt.ylabel(‘AUC score‘)
plt.xlabel(‘min samples leaf‘)
plt.show()
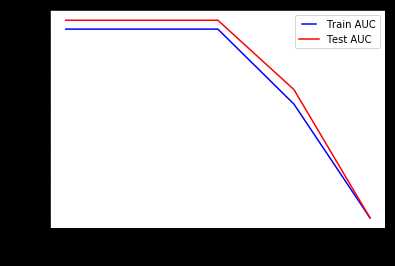
与前一个参数相同的结论。 增加此值可能会导致拟合不足。
max_features表示查找最佳拆分时要考虑的要最大特征数量。
max_features = list(range(1,data.shape[1]))
train_results = []
test_results = []
for max_feature in max_features:
    dt = DecisionTreeClassifier(max_features=max_feature)
    dt.fit(x_train, y_train)
    train_pred = dt.predict(x_train)
    false_positive_rate, true_positive_rate, thresholds = roc_curve(y_train, train_pred)
    roc_auc = auc(false_positive_rate, true_positive_rate)
    train_results.append(roc_auc)
    y_pred = dt.predict(x_test)
    false_positive_rate, true_positive_rate, thresholds = roc_curve(y_test, y_pred)
    roc_auc = auc(false_positive_rate, true_positive_rate)
    test_results.append(roc_auc)

from matplotlib.legend_handler import HandlerLine2D

line1, = plt.plot(max_features, train_results, ‘b‘, label=‘Train AUC‘)
line2, = plt.plot(max_features, test_results, ‘r‘, label=‘Test AUC‘)
plt.legend(handler_map={line1: HandlerLine2D(numpoints=2)})
plt.ylabel(‘AUC score‘)
plt.xlabel(‘max features‘)
plt.show()
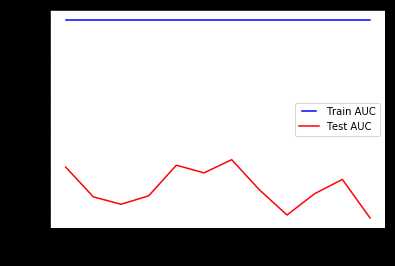
这也是一个过度拟合的情况。 根据决策树的sklearn文档,在找到节点样本的至少一个有效区分之前,搜索分割不会停止,因为它需要检查多于max_features的特征数量。
这篇文章研究了模型参数如何影响过度拟合和欠拟合的性能,希望对您有所帮助。
标签:文章 特征工程 style otl baseline cat 绘制 pen ddc
原文地址:https://www.cnblogs.com/jin-liang/p/9638197.html