标签:als 取数据 选型 current linux tag minimum send nload
一、环境准备接下来我们进行初步的探视,利用测试环境体验下ELK Stack + Filebeat,测试环境我们就不进行 Kafka 的配置了,因为他的存在意义在于提高可靠性。
Filebeat 6.4.0
Logstash 6.4.0
Elasticsearch 6.4.0
Kibana 6.4.0
JDK 1.8.0_181
| IP | 系统 | 角色 |
|---|---|---|
| 172.18.2.100 | CentOS 7.4.1708 | Logstash, ES, Kibana |
| 172.18.2.101 | CentOS 7.4.1708 | Filebeat |
| 172.18.2.102 | CentOS 7.3.1611 | Filebeat |
需要打通172.18.2.100至所有 agent 的 SSH 免密登录。
[root@ES ~]# ssh-copy-id 172.18.2.101
[root@ES ~]# ssh-copy-id 172.18.2.102ELK 需要 Oracle 1.7(或者是 OpenJDK 1.7) 及以上,建议下载 Oracle 官方的 JDK,我们这里下载的是官方的 rpm 包。
rpm -ivh jdk-8u181-linux-x64.rpmELK 官网对于每种软件提供了多种格式的安装包(zip/tar/rpm/DEB),以 Linux 系列系统为例,如果直接下载 RPM,可以通过 rpm -ivh path_of_your_rpm_file直接安装成系统 service。以后就可以使用 service 命令启停。比如service elasticsearch start/stop/status。很简单,我们主要就使用这种方式进行安装。
wget https://artifacts.elastic.co/downloads/elasticsearch/elasticsearch-6.4.0.rpmrpm -ivh elasticsearch-6.4.0.rpm修改/etc/elasticsearch/elasticsearch.yml。
cluster.name: myes
node.name: es1.wzlinux.com
path.data: /var/lib/elasticsearch
path.logs: /var/log/elasticsearch
network.host: 172.18.2.100
http.port: 9200systemctl daemon-reload
systemctl start elasticsearch.servicesystemctl enable elasticsearch.service[root@ES ~]# curl ‘http://172.18.2.100:9200‘
{
"name" : "es1.wzlinux.com",
"cluster_name" : "myes",
"cluster_uuid" : "q54RkYTLTKuVaSytrTXiAg",
"version" : {
"number" : "6.4.0",
"build_flavor" : "default",
"build_type" : "rpm",
"build_hash" : "595516e",
"build_date" : "2018-08-17T23:18:47.308994Z",
"build_snapshot" : false,
"lucene_version" : "7.4.0",
"minimum_wire_compatibility_version" : "5.6.0",
"minimum_index_compatibility_version" : "5.0.0"
},
"tagline" : "You Know, for Search"
}可以看到,它跟其他的节点的传输端口为9300,接受HTTP请求的端口为9200。
[root@ES ~]# netstat -tlnp
Active Internet connections (only servers)
Proto Recv-Q Send-Q Local Address           Foreign Address         State       PID/Program name
tcp        0      0 0.0.0.0:22              0.0.0.0:*               LISTEN      903/sshd
tcp        0      0 127.0.0.1:25            0.0.0.0:*               LISTEN      1001/master
tcp6       0      0 172.18.2.100:9200       :::*                    LISTEN      11885/java
tcp6       0      0 172.18.2.100:9300       :::*                    LISTEN      11885/java
tcp6       0      0 :::22                   :::*                    LISTEN      903/sshd
tcp6 0 0 ::1:25 :::* LISTEN 1001/master wget https://artifacts.elastic.co/downloads/logstash/logstash-6.4.0.rpmrpm -ivh logstash-6.4.0.rpm一个Logstash的pipeline由3部分组成:input, filter, output。

在我们的架构中,Logstash的input是beats,output是ES,需要对应的插件。
cd /usr/share/logstash/
bin/logstash-plugin install logstash-input-beats修改文件/etc/logstash/conf.d/logstash.conf。
input {
  beats {
    port => 5044
  }
}

output {
  elasticsearch {
    hosts => "172.18.2.100:9200"
    manage_template => false
    index => "%{[@metadata][beat]}-%{+YYYY.MM.dd}"
    document_type => "%{[@metadata][type]}"
  }
}
Logstash 使用该配置使用 ES 的索引,和 Filebeat 做的事情是一样的,不过拥有了额外的缓存以及强大丰富的插件库。
systemctl start logstash.serviceKibana 从 ES 获取数据做前端的可视化展示。 它提供了用户体验极佳的高定制化 UI,可以灵活配置出你需要的 Dashboard。 Dashboard 可以轻易的保存、链接和分享。
wget https://artifacts.elastic.co/downloads/kibana/kibana-6.4.0-x86_64.rpmrpm -ivh kibana-6.4.0-x86_64.rpm编辑/etc/kibana/kibana.yml。
elasticsearch.url: "http://172.18.2.100:9200"
server.host: "172.18.2.100"systemctl daemon-reload
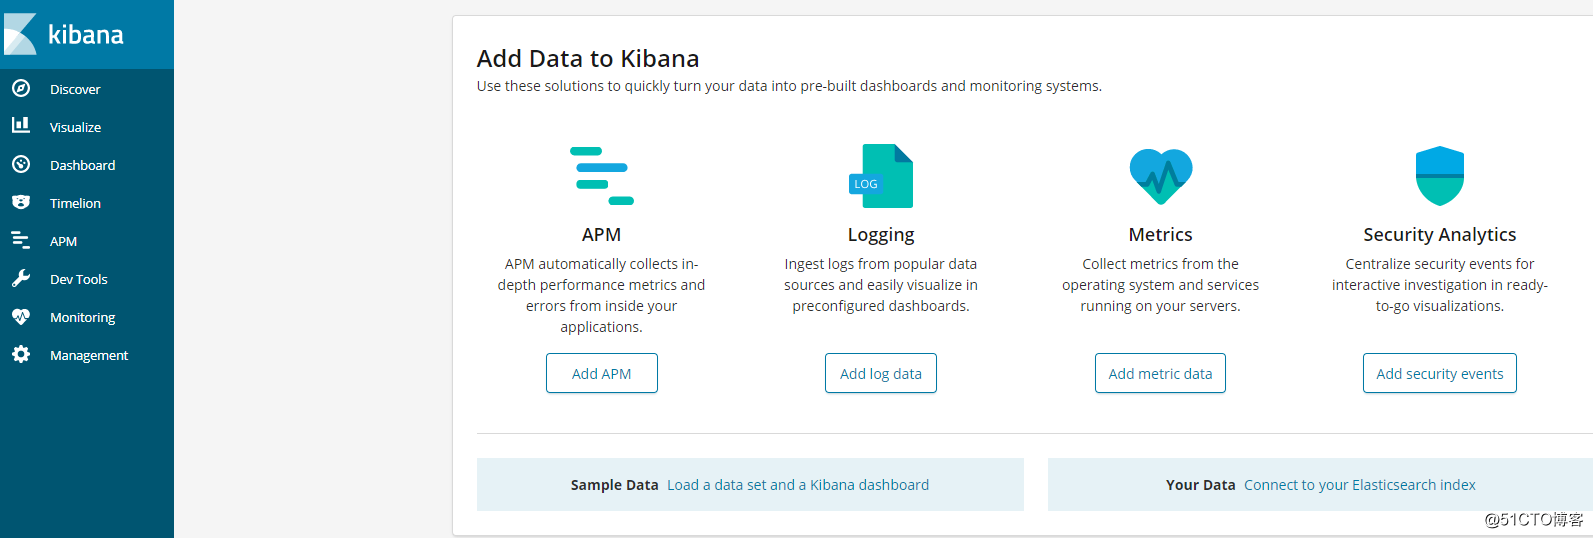
systemctl start kibana.service在浏览器中访问http://172.18.2.100:5601。
在172.18.2.101、172.18.2.102上进行Filebeat的安装。
wget https://artifacts.elastic.co/downloads/beats/filebeat/filebeat-6.4.0-x86_64.rpmrpm -ivh filebeat-6.4.0-x86_64.rpm修改/etc/filebeat/filebeat.yml,把日志输出指向logstash,关闭Elasticsearch output。
#----------------------------- Logstash output --------------------------------
output.logstash:
hosts: ["172.18.2.100:5044"]因为我们的输出不是 ES,所以我们需要手动添加 Index Pattern。
[root@node2 ~]# filebeat setup --template -E output.logstash.enabled=false -E ‘output.elasticsearch.hosts=["172.18.2.100:9200"]‘
Loaded index templatesystemctl start filebeat标签:als 取数据 选型 current linux tag minimum send nload
原文地址:http://blog.51cto.com/wzlinux/2175836