标签:rod website status cli format width hat color amp
It would be helpful once you can see what information have been tracking inside you web application,
We can use Teailumn debugger for that, inside Chrome,
"Bookmarks" --> "Bookmark manager" --> "Settings" --> "Add new bookmark"
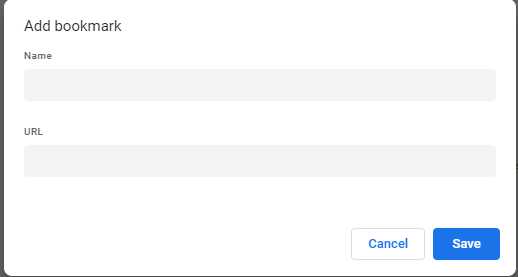
Give a "name" and paste the URL below:
javascript:void(window.open("","utagmon","width=600,height=600,location=0,menubar=0,status=1,toolbar=0,resizable=1,scrollbars=1").document.write("<script language=‘JavaScript‘ id=‘utagmon‘src=‘//tags.tiqcdn.com/utag/tealium-solutions/main/prod/utag.4.js?opt_show_enrich=0&opt_show_meta=0&opt_show_tiq=1&opt_show_dom=0&opt_show_jspage=0&opt_show_cookie=0&_cb="+Math.random() +"‘></"+"script>"))
Then in the bookmark bar, you will see the bookmark you created:
When you want to debugger the website, just click open the dubbger.
[Analytics] Add Tealium debugger in Chrome
标签:rod website status cli format width hat color amp
原文地址:https://www.cnblogs.com/Answer1215/p/9696258.html