标签:false pytho else 绘制 ext http info 为什么 imp
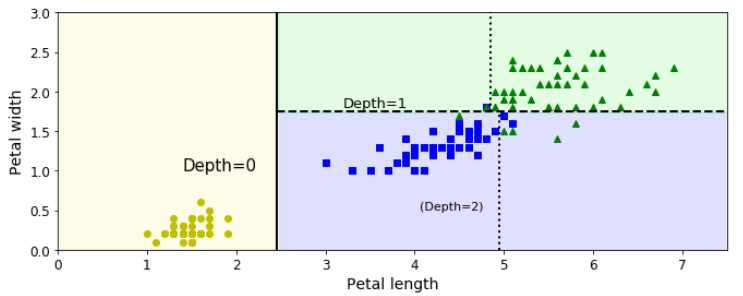
要明白机器学习画图的一个思路,就是全局生成坐标节点,然后让模型进行学习,这样可以得到一个全局的效果图(比如等高线),然后再把指定的数据扔到模型中让其学习,获取分类,然后再把这些局部点绘制出来,和整体的效果图进行比较,将会发现非常吻合。
 1 from matplotlib.colors import ListedColormap
 2 from pprint import pprint
 3 def plot_decision_boundary(clf, X, y, axes=[0, 7.5, 0, 3], iris=True,
 4                            legend=False, plot_training=True):
 5     # python经典的生成全面点的实现
 6     x1s = np.linspace(axes[0], axes[1], 100)
 7     x2s = np.linspace(axes[2], axes[3], 100)
 8     x1, x2 = np.meshgrid(x1s, x2s)
 9     X_new = np.c_[x1.ravel(), x2.ravel()] # 所有的点生成,本身是一个二维数组
10     # 预测种类,clf.repdict(X_new)其实是一个行向量(X_new每个二元坐标组将会对应一个分类,所以X_new是二维,但是y_pred是一维),
11     # reshape就是要转换成和X1相对应的形式,x1是(100, 100)的二维数组;但是,问题是为什么要reshape一下?因为在下面的等高线绘制
12     # 的内部处理中,将会生成一个(100, 100)的点集,然后根据类型进行等高线着色,那么根据每个点集的索引(比如[0][1])找到对应的
13     # 分类进行,然后决定着色种类,所以y_pred需要进行reshape为二维数组。
14     y_pred = clf.predict(X_new).reshape(x1.shape)
15
16
17     print("len(x1):{},x1.size:{}".format(len(x1), x1.size))
18     pprint(x1)
19     print("len(x2):{},x2.size:{}".format(len(x2), x2.size))
20     pprint(x2)
21     print("len(X_new): {}; X_new.size: {}".format(len(X_new), X_new.size))
22     pprint(X_new)
23     tmp = clf.predict(X_new)
24     print("len(ctrl.predict(X_new)): {}; ctrl.predict(X_new).size: {}".format(len(tmp), tmp.size))
25     pprint(tmp)
26     pprint("x1.shape:")
27     pprint(x1.shape)
28     tmp2 = tmp.reshape(x1.shape)
29     print("len(ctrl.predict(tmp2.reshape)): {}; ctrl.predict(tmp2.reshape).size: {}".format(len(tmp2),
30                                                                                             tmp2.size))
31     pprint(tmp2)
32
33
34
35
36
37     custom_cmap = ListedColormap([‘#fafab0‘,‘#9898ff‘,‘#a0faa0‘])
38     plt.contourf(x1, x2, y_pred, alpha=0.3, cmap=custom_cmap, linewidth=10)
39     if not iris:
40         custom_cmap2 = ListedColormap([‘#7d7d58‘,‘#4c4c7f‘,‘#507d50‘])
41         plt.contour(x1, x2, y_pred, cmap=custom_cmap2, alpha=0.8)
42     # 上面做的事情是全局的绘制等高线,那么对于指定数据(作为入参)的处理,是在下面进行的,指定数据绘制的结果应该是和等高线吻合的
43     if plot_training:
44         plt.plot(X[:, 0][y==0], X[:, 1][y==0], "yo", label="Iris-Setosa")
45         plt.plot(X[:, 0][y==1], X[:, 1][y==1], "bs", label="Iris-Versicolour")
46         plt.plot(X[:, 0][y==2], X[:, 1][y==2], "g^", label="Iris-Virginica")
47         plt.axis(axes)
48     if iris:
49         plt.xlabel("Petal length", fontsize=14)
50         plt.ylabel("Petal width", fontsize=14)
51     else:
52         plt.xlabel(r"$x_1$", fontsize=18)
53         plt.ylabel(r"$x_2$", fontsize=18, rotation=0)
54     if legend:
55         plt.legend(loc="lower right", fontsize=14)
56
57 plt.figure(figsize=(11, 4))
58 plot_decision_boundary(tree_clf, X, y)
59 plt.plot([2.45, 2.45], [0, 3], "k-", linewidth=2)
60 plt.plot([2.45, 7.5], [1.75, 1.75], "k--", linewidth=2)
61 plt.plot([4.95, 4.95], [0, 1.75], "k:", linewidth=2)
62 plt.plot([4.85, 4.85], [1.75, 3], "k:", linewidth=2)
63 plt.text(1.40, 1.0, "Depth=0", fontsize=15)
64 plt.text(3.2, 1.80, "Depth=1", fontsize=13)
65 plt.text(4.05, 0.5, "(Depth=2)", fontsize=11)
66
67 # save_fig("decision_tree_decision_boundaries_plot")
68 plt.show()
输出内容:
len(x1):100,x1.size:10000
array([[0.        , 0.07575758, 0.15151515, ..., 7.34848485, 7.42424242,
        7.5       ],
       [0.        , 0.07575758, 0.15151515, ..., 7.34848485, 7.42424242,
        7.5       ],
       [0.        , 0.07575758, 0.15151515, ..., 7.34848485, 7.42424242,
        7.5       ],
       ...,
       [0.        , 0.07575758, 0.15151515, ..., 7.34848485, 7.42424242,
        7.5       ],
       [0.        , 0.07575758, 0.15151515, ..., 7.34848485, 7.42424242,
        7.5       ],
       [0.        , 0.07575758, 0.15151515, ..., 7.34848485, 7.42424242,
        7.5       ]])
len(x2):100,x2.size:10000
array([[0.        , 0.        , 0.        , ..., 0.        , 0.        ,
        0.        ],
       [0.03030303, 0.03030303, 0.03030303, ..., 0.03030303, 0.03030303,
        0.03030303],
       [0.06060606, 0.06060606, 0.06060606, ..., 0.06060606, 0.06060606,
        0.06060606],
       ...,
       [2.93939394, 2.93939394, 2.93939394, ..., 2.93939394, 2.93939394,
        2.93939394],
       [2.96969697, 2.96969697, 2.96969697, ..., 2.96969697, 2.96969697,
        2.96969697],
       [3.        , 3.        , 3.        , ..., 3.        , 3.        ,
        3.        ]])
len(X_new): 10000; X_new.size: 20000
array([[0.        , 0.        ],
       [0.07575758, 0.        ],
       [0.15151515, 0.        ],
       ...,
       [7.34848485, 3.        ],
       [7.42424242, 3.        ],
       [7.5       , 3.        ]])
len(ctrl.predict(X_new)): 10000; ctrl.predict(X_new).size: 10000
array([0, 0, 0, ..., 2, 2, 2])
u‘x1.shape:‘
(100L, 100L)
len(ctrl.predict(tmp2.reshape)): 100; ctrl.predict(tmp2.reshape).size: 10000
array([[0, 0, 0, ..., 1, 1, 1],
       [0, 0, 0, ..., 1, 1, 1],
       [0, 0, 0, ..., 1, 1, 1],
       ...,
       [0, 0, 0, ..., 2, 2, 2],
       [0, 0, 0, ..., 2, 2, 2],
       [0, 0, 0, ..., 2, 2, 2]])

标签:false pytho else 绘制 ext http info 为什么 imp
原文地址:https://www.cnblogs.com/xiashiwendao/p/9826451.html