标签:127.0.0.1 nump 线性模型 tensor new reduce esc 技术 sum
tensorboard用以图形化展示我们的代码结构和图形化训练误差等,辅助优化程序
参考链接:www.cnblogs.com/fydeblog/p/7429344.html
import tensorflow as tf

with tf.name_scope('graph') as scope:
    a = tf.constant([[3,4]],name = 'a')
    b = tf.constant([[5],[6]],name = 'b')
    product = tf.matmul(a,b,name='product')

sess = tf.Session()
writer = tf.summary.FileWriter('./tensorflow/',sess.graph)
init = tf.global_variables_initializer()
sess.run(init)运行代码之后可以在目录./tensorboard/ 下看到生成了一个文件,用于启动tensorboard。执行tensorboard --logdir ./tensorflow/,打开浏览器127.0.0.1:6006 ,可以看到视图
注:要保证该文件夹下只有一个文件
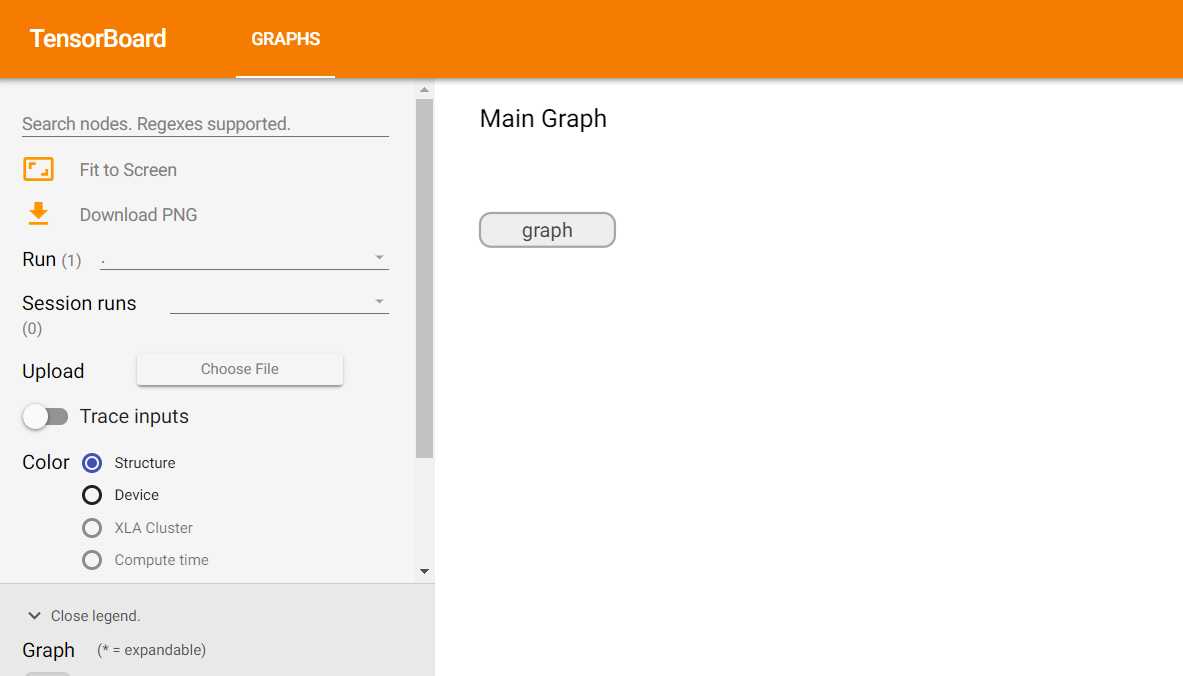
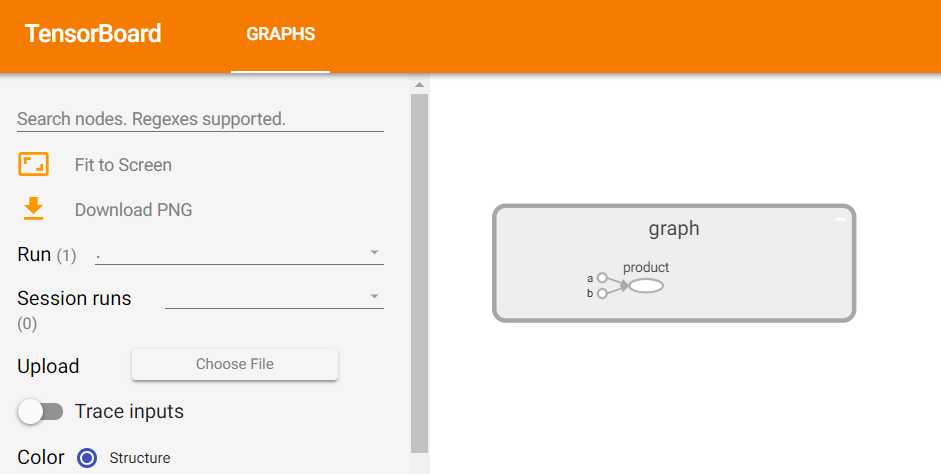
双击graph可以进一步打开,这就是我们这段微代码的结构
这里我们基于之前的一段代码,与tensorboard相结合来看下效果。
前文链接:https://www.cnblogs.com/maskerk/p/9973503.html
import tensorflow as tf
import matplotlib.pyplot as plt
import numpy as np

#样本数据
with tf.name_scope('sample-data'):
    x_train = np.linspace(-1,1,300)[:,np.newaxis]
    noise = np.random.normal(0, 0.1, x_train.shape)
    y_train = x_train * 3 + noise + 0.8

#
with tf.name_scope('hold-data'):
    x = tf.placeholder(tf.float32, [None, 1])
    y = tf.placeholder(tf.float32, [None, 1])

#线性模型
with tf.name_scope('line-model'):
    W = tf.Variable([0.1],dtype = tf.float32,name='W')
    #添加变量W到tensorboard的Distributions下
    tf.summary.histogram('Weight',W)
    b = tf.Variable([0.1],dtype = tf.float32,name='b')
    line_model = W * x + b
    #添加变量b到tensorboard的Distributions下
    tf.summary.histogram('bias',b)

#损失模型
with tf.name_scope("loss-model"):
    loss = tf.reduce_sum(tf.square(line_model - y))
    #添加变量loss到tensorboard的Scalars下
    tf.summary.scalar("loss",loss)


#创建优化器
with tf.name_scope("optimizer-model"):
    optimizer = tf.train.GradientDescentOptimizer(0.001)
    train = optimizer.minimize(loss)

#初始化变量
with tf.name_scope("init-model"):
    init = tf.global_variables_initializer()
    sess = tf.Session()
    sess.run(init)

# 绘制样本数据
fig = plt.figure()
ax = fig.add_subplot(1,1,1)
ax.scatter(x_train, y_train)
plt.ion()
plt.show()
plt.pause(1)

#将所有的summary全部保存磁盘
merged = tf.summary.merge_all()

#tensorboard所需数据写入文件
writer = tf.summary.FileWriter('./tensorflow/',sess.graph)

#训练100次
for i in range(100):
    if i % 10 == 0:
        #每隔10次打印1次成果
        print(i)
        print('W:%s  b:%s' % (sess.run(W),sess.run(b)))
        print('loss:%s' % (sess.run(loss,{x:x_train,y:y_train})))

        #绘制拟合直线
        try:
            ax.lines.remove(lines[0])
        except Exception:
                        pass
        lines = ax.plot(x_train, sess.run(W)*x_train+sess.run(b), 'r-', lw=5)
        plt.pause(1)

    sess.run(train,{x:x_train,y:y_train})

    #向tensorboard添加数据
    rs = sess.run(merged,{x:x_train,y:y_train})
    writer.add_summary(rs,i)

# 打印训练100次后的成果
print('---')
print('W:%s  b:%s' % (sess.run(W),sess.run(b)))
print('loss:%s' % (sess.run(loss,{x:x_train,y:y_train})))
相比前文,这里添加了两部分
1.拟合直线的动态变化图像
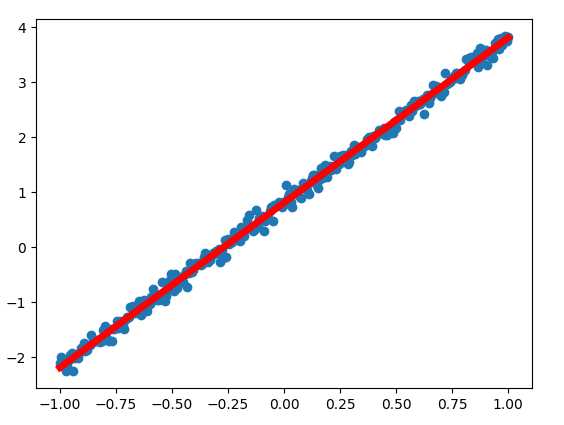
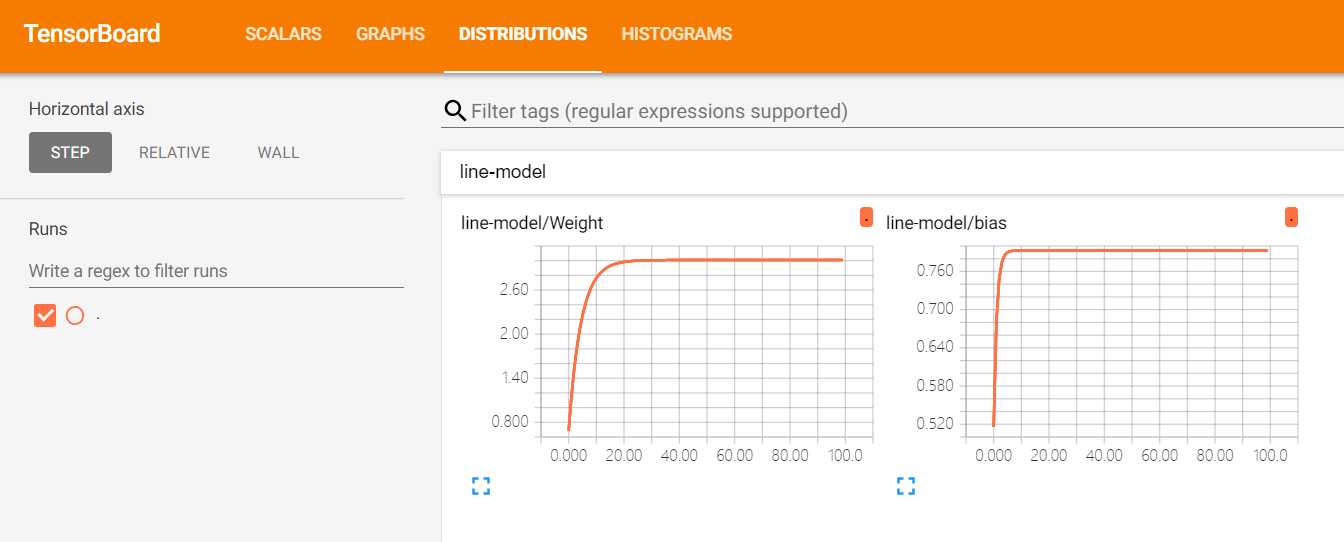
2.tensorboard展现数据变化过程
tensorboard --logdir ./tensorflow/可以看到loss(误差大小)的变化曲线
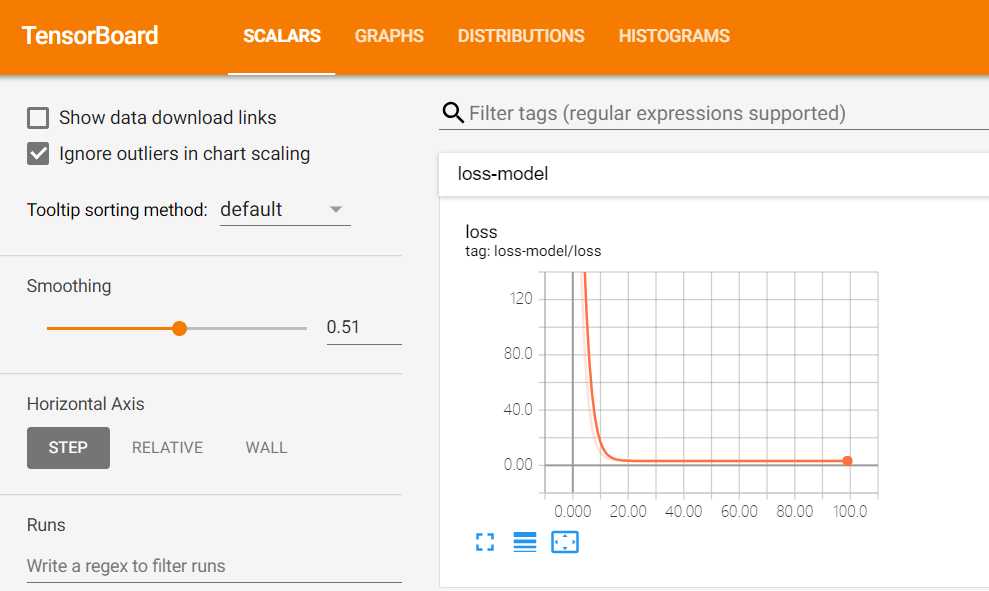
权重值W和偏差b的变化曲线(y = W * x + b)
标签:127.0.0.1 nump 线性模型 tensor new reduce esc 技术 sum
原文地址:https://www.cnblogs.com/maskerk/p/9973664.html