标签:字体 style comm 字符显示 dict 公式 中文乱码 文本 code
pyplot默认不支持中文字符,因为默认字体是sans-serif,英文字体不能显示中文
方法1,修改需要输出中文字符的地方
在有中文输出的地方,添加属性:fontproperties
import matplotlib.pyplot as plt

plt.plot([3,1,5,4,2])
plt.xlabel(‘X轴值‘)
plt.ylabel(‘Y轴值‘,fontproperties=‘SimHei‘)

plt.show()
方法2,修改全局默认字体
例子:
import matplotlib.pyplot as plt

import matplotlib #载入matplotlib完整库
matplotlib.rcParams[‘font.family‘]=‘Microsoft Yahei‘ #字体,改为微软雅黑,默认 sans-serif
matplotlib.rcParams[‘font.size‘]=32 #字体大小,整数字号,默认10

plt.plot([3,1,5,4,2])
plt.xlabel(‘X axis‘)
plt.ylabel(‘Y轴值‘)

plt.show()
一些系统通用中文字体名称(英文名称)
plt.annotate(string,xy=arrow_crd,xytext=text_crd,arrowprops=dict)注:当字符串里有反斜杠等转义特殊字符时,字符串前加r,表示显示原始字符串
例子:
import matplotlib.pyplot as plt

plt.plot([3,1,5,4,2])

plt.xlabel(r‘X \axis‘) #字符串前加r显示原始字符串

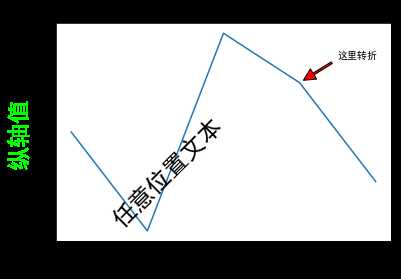
plt.ylabel(‘纵轴值‘,fontproperties=‘SimHei‘,color=‘#00ff00‘,fontsize=‘24‘)

plt.title(‘图表标题 $a^{2}+b^{2}=C^{2}$‘,fontproperties=‘SimHei‘) #可以使用$引入一部分latex文本排版语法和公式

plt.text(0.5,3,‘任意位置文本‘,fontproperties=‘SimHei‘,fontsize=‘24‘,rotation=45) #任意文本的x,y坐标值(可用latex语法),旋转角度

plt.annotate(
    ‘这里转折‘, #显示字符串
    fontproperties=‘SimHei‘, # 中文字体
    xy=(3,4), # 箭头位置
    xytext=(3.5,4.5), # 文本位置
    arrowprops=dict(facecolor=‘red‘,shrink=0.1,width=2) # facecolor:箭头颜色;shrink:箭头的起始和结束位置两侧的空白大小;width:箭头宽度
)

plt.show()

标签:字体 style comm 字符显示 dict 公式 中文乱码 文本 code
原文地址:https://www.cnblogs.com/yoyo1216/p/10131637.html