标签:ini command plt basic designer please nload extend pre
Profile
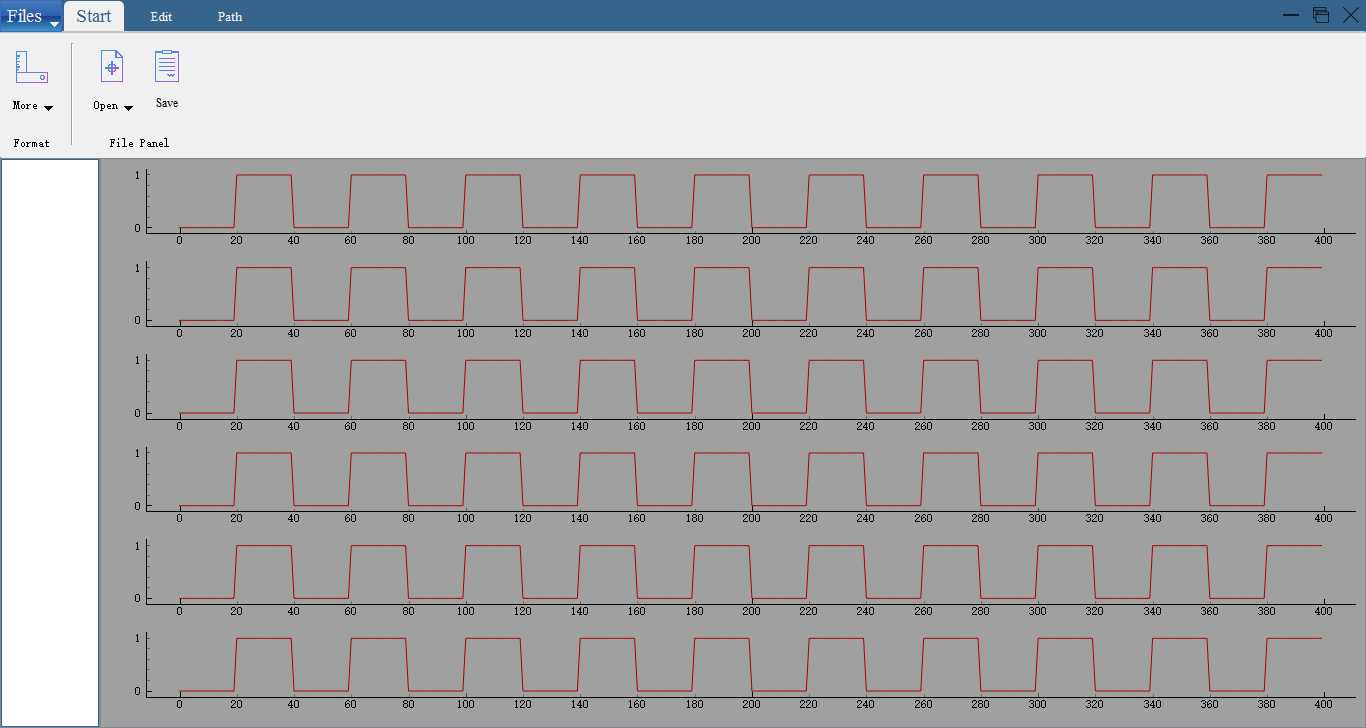
The Following Picture is the result of this time‘s work. It‘s the first step used to verify the basic function of PyQtGraph.
Download PyQtGraph
It‘s Always recommanded to download PyqtGraph through pip, As
pip install pyqtgraph
If you want to speed up the download process, you can use the one provided by DouBan, use command as
pip install pyqtgraph -i https://pypi.douban.com/simple
Inherit pyqtgraph.GraphicLayoutWidget in QtDesigner
The basic conception of inheriting modules in QtDesigner would not be mentioned here. Please google/baidu it by your self.
Following picture is the configuration.
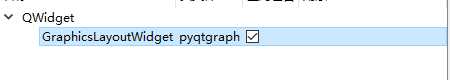
After using PyUIC to Create the MainWindow class, you would have found all this widget‘s setup is updated.
self.Graphics_container = GraphicsLayoutWidget()
self.Graphics_container.setGeometry(QtCore.QRect(0, 0, 1200, 450))
self.Graphics_container.setMinimumSize(QtCore.QSize(1200, 0))
self.Graphics_container.setObjectName("Graphics_container")
The GraphicsLayoutWidget would be imported as well
from pyqtgraph import GraphicsLayoutWidget
Add new Graph in the Widget
        plt1 = self.Graphics_container.addPlot(row=0,col=0)
        plt2 = self.Graphics_container.addPlot(row=1,col=0)
        plt3 = self.Graphics_container.addPlot(row=2,col=0)
        plt4 = self.Graphics_container.addPlot(row=3,col=0)
        plt5 = self.Graphics_container.addPlot(row=4,col=0)
        plt6 = self.Graphics_container.addPlot(row=5,col=0)
Create Pattern of Graph
        list1 = []
        for i in range(10):
            list1.extend(np.zeros(20))
            list1.extend(np.ones(20))
Call Pattern in the Graph
        plt1.plot(list1,pen=pg.mkPen(color=‘#AA0000‘, width=1),name="Red Line")
        plt2.plot(list1,pen=pg.mkPen(color=‘#AA0000‘, width=1),name="Green Line")
        plt3.plot(list1,pen=pg.mkPen(color=‘#AA0000‘, width=1),name="Blue Line")
        plt4.plot(list1,pen=pg.mkPen(color=‘#AA0000‘, width=1),name="Green Line")
        plt5.plot(list1,pen=pg.mkPen(color=‘#AA0000‘, width=1),name="Green Line")
        plt6.plot(list1,pen=pg.mkPen(color=‘#AA0000‘, width=1),name="Green Line")
pg is the pyqtGraph, which was imported as pg, through mkpen(**args) we can define the brush used in the Graph, you can use the same way add more Lines in the same plot
These is the first part of my Work, To be Continue
标签:ini command plt basic designer please nload extend pre
原文地址:https://www.cnblogs.com/GNOPS/p/10168242.html