标签:nbsp html long mil hat enc oct symbol val
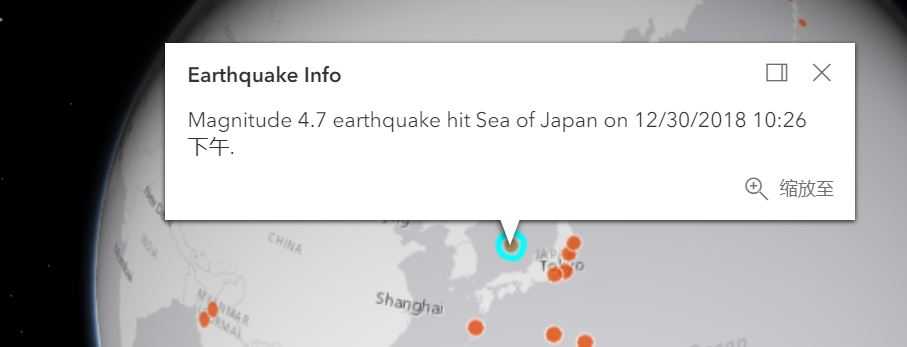
The CSVLayer allows you to add features from a comma-separated values text file (.csv) or delimited text file (.txt) that include latitude and longitude information.

<!DOCTYPE html>
<html>
<head>
<meta charset="utf-8">
<meta name="viewport" content="initial-scale=1,maximum-scale=1,user-scalable=no">
<title>CSVLayer - 4.10</title>
<link rel="stylesheet" href="https://js.arcgis.com/4.10/esri/css/main.css">
<style>
html,
body,
#viewDiv {height: 100%;width: 100%;margin: 0;padding: 0;font-family: sans-serif;}
</style>
<script src="https://js.arcgis.com/4.10/"></script>
<script>
require([
"esri/Map",
"esri/layers/CSVLayer",
"esri/views/SceneView",
"esri/core/urlUtils"
],function(
Map,
CSVLayer,
SceneView,
urlUtils
)
{
// Paste the url into a browser‘s address bar to download and view the attributes
// in the CSV file. These attributes include:
// * mag - magnitude
// * type - earthquake or other event such as nuclear test
// * place - location of the event
// * time - the time of the event

var template = {
title:"Earthquake Info",
content:"Magnitude {mag} {type} hit {place} on {time}."
}
var csvLayer = new CSVLayer({
url:"https://earthquake.usgs.gov/earthquakes/feed/v1.0/summary/2.5_week.csv",
// If CSV files are not on the same domain as your website, a CORS enabled server // or a proxy is required. copyright:"USGS Earthquakes",
popupTemplate:template,
elevationInfo:{
// drapes icons on the surface of the globe mode:"on-the-ground"
}
});
csvLayer.renderer = {
type:"simple",
// autocasts as new SimpleRenderer() symbol:{
type:"point-3d",
// autocasts as new PointSymbol3D() symbolLayers:[{
type:"icon",
// autocasts as new IconSymbol3DLayer() material:{
color:[238, 69, 0, 0.75]
},
outline:{
width:0.5,
color:"white"
},
size:"12px"
}]
}
}
var map = new Map({
basemap:"gray",
layers:[csvLayer]
});
var view = new SceneView({
container:"viewDiv",
map:map,
center:[138, 35],
zoom:4
})
})
</script>
</head>
<body>
<div id="viewDiv"></div>
</body>
</html>
CSVLayer
标签:nbsp html long mil hat enc oct symbol val
原文地址:https://www.cnblogs.com/GIS-Yangol/p/10206066.html

