标签:gpl sns tip img mat .sh 回归分析 tips 绘图
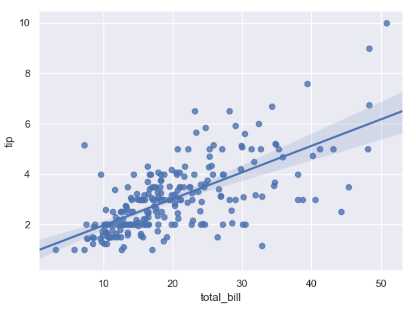
1. sns.regplot() 和 sns.lmplot() 绘制回归曲线
import numpy as np
import pandas as pd
from scipy import stats, integrate
import matplotlib.pyplot as plt

import seaborn as sns
sns.set(color_codes=True)
np.random.seed(sum(map(ord, ‘distributions‘)))

tips = sns.load_dataset(‘tips‘)
print(tips.head())

# regplot() 和 lmplot() 画出拟合曲线
sns.regplot(x=‘total_bill‘, y=‘tip‘, data=tips)
plt.show()

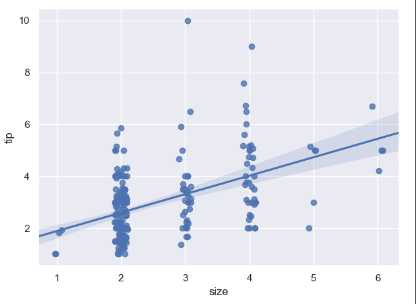
2. 对于离散的变量来说,可以添加x_jitter产生随机的偏移
sns.regplot(x=‘size‘, y=‘tip‘, data=tips, x_jitter=0.1)
plt.show()

标签:gpl sns tip img mat .sh 回归分析 tips 绘图
原文地址:https://www.cnblogs.com/my-love-is-python/p/10245172.html