标签:第五天 hue pair idt 散点图 cat white code ica
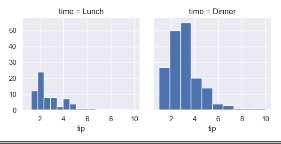
1. sns.Facetgrid 画一个基本的直方图
import numpy as np
import pandas as pd
from scipy import stats, integrate
import matplotlib.pyplot as plt

import seaborn as sns
sns.set(color_codes=True)
np.random.seed(sum(map(ord, ‘distributions‘)))

tips = sns.load_dataset(‘tips‘)
# 使用sns.Facetgrid 画一个基本的直方图
g = sns.FacetGrid(tips, col=‘time‘)
g.map(plt.hist, ‘tip‘)
plt.show()
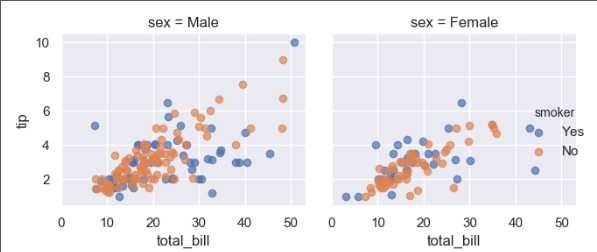
2 . 添加sns.Facetgrid属性hue,画散点图
g = sns.FacetGrid(tips, col=‘sex‘, hue=‘smoker‘)
g.map(plt.scatter, ‘total_bill‘, ‘tip‘, alpha=0.7)
g.add_legend()
plt.show()
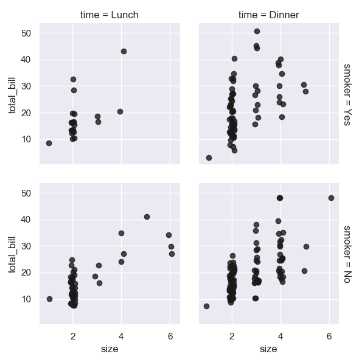
3. 使用color=‘0.1‘来定义颜色, margin_titles=True把标题分开, fit_reg是否画拟合曲线,sns.regplot画回归图
g = sns.FacetGrid(tips, col=‘time‘, row=‘smoker‘, margin_titles=False)
g.map(sns.regplot, ‘size‘, ‘total_bill‘, color=‘0.1‘, fit_reg=False, x_jitter=0.1)
plt.show()
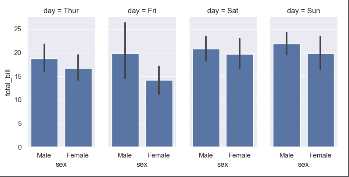
4. 绘制条形图,同时使用Categorical 生成col对应顺序的条形图, row_order 写入新的顺序的排列
g = sns.FacetGrid(tips, col=‘day‘, size=4, aspect=0.5)
g.map(sns.barplot, ‘sex‘, ‘total_bill‘)
plt.show()
# 指定col顺序进行画图
from pandas import Categorical
# 打印当前的day的顺序
ordered_days = tips.day.value_counts().index
# 指定顺序
ordered_sys = Categorical([‘Thur‘, ‘Fri‘, ‘Sat‘, ‘Sun‘])
g = sns.FacetGrid(tips, col=‘day‘, size=4, aspect=0.5, row_order=ordered_days)
g.map(sns.barplot, ‘sex‘, ‘total_bill‘)
plt.show()
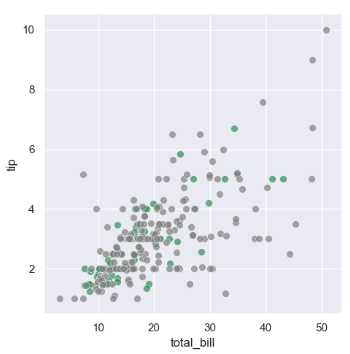
5. 绘制多变量指定颜色,通过palette添加颜色
pal = {‘Lunch‘:‘seagreen‘, ‘Dinner‘:‘gray‘}
# size 指定外面的大小
g = sns.FacetGrid(tips, hue=‘time‘, palette=pal, size=5)
# s指定圆的大小, linewidth=0.5边缘线的宽度,egecolor边缘的颜色
g.map(plt.scatter, ‘total_bill‘, ‘tip‘, s=50, alpha=0.7, linewidth=0.5, edgecolor=‘white‘)
plt.show()
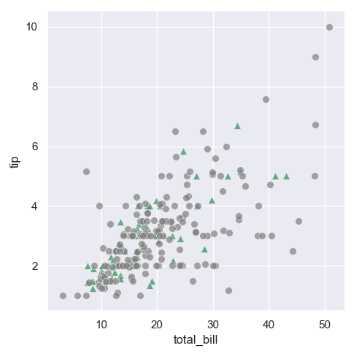
6. hue_kws={‘marker‘:[‘^‘, ‘o‘]}
pal = {‘Lunch‘:‘seagreen‘, ‘Dinner‘:‘gray‘}
# size 指定外面的大小
g = sns.FacetGrid(tips, hue=‘time‘, palette=pal, size=5, hue_kws={‘marker‘:[‘^‘, ‘o‘]})
# s指定圆的大小, linewidth=0.5边缘线的宽度,egecolor边缘的颜色
g.map(plt.scatter, ‘total_bill‘, ‘tip‘, s=50, alpha=0.7, linewidth=0.5, edgecolor=‘white‘)
plt.show()
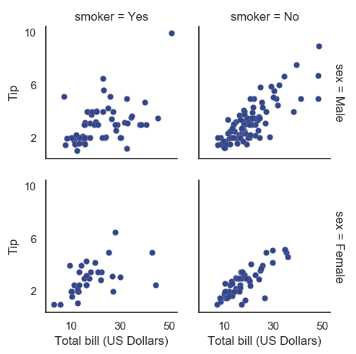
7. 设置set_axis_labels 设置坐标, g.fig.subplots_adjust(wspace=0.2, hspace) 表示子图与子图之间的间隔
with sns.axes_style(‘white‘):
    g = sns.FacetGrid(tips, row=‘sex‘, col=‘smoker‘, margin_titles=True, size=2.5)

# lw表示球的半径
g.map(plt.scatter, ‘total_bill‘, ‘tip‘, color=‘#334488‘, edgecolor=‘white‘, lw=0.1)
g.set_axis_labels(‘Total bill (US Dollars)‘, ‘Tip‘)
# 设置x轴的范围
g.set(xticks=[10, 30, 50], yticks=[2, 6, 10])
# wspace 和 hspace 设置子图与子图之间的距离
g.fig.subplots_adjust(wspace=0.2, hspace=0.2)
# 调子图的偏移
# g.fig.subplots_adjust(left=)
plt.show()
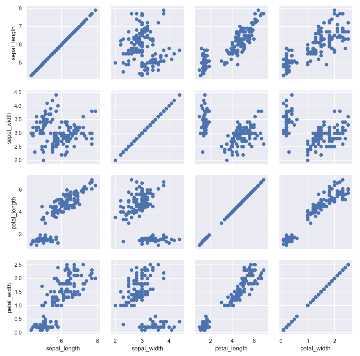
8. sns.PairGrid(iris) # 进行两两变量绘图
g = sns.PairGrid(iris)
g.map(plt.scatter)
plt.show()
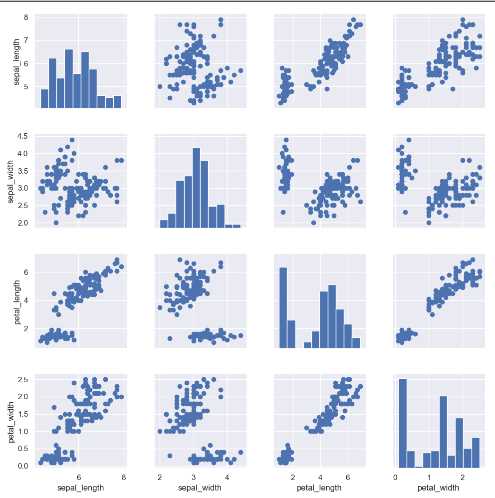
9. 将主对角线和非对角线的画图方式分开
g = sns.PairGrid(iris)
g.map_diag(plt.hist)
g.map_offdiag(plt.scatter)
plt.show()
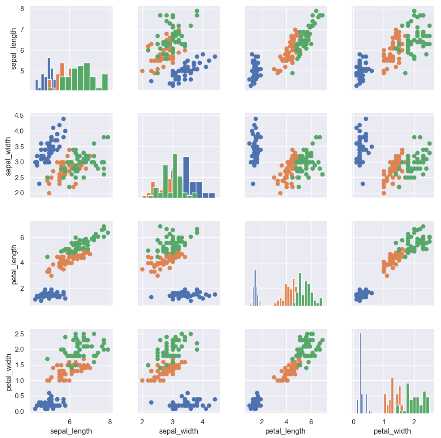
10 多加上一个属性进行画图操作
g = sns.PairGrid(iris, hue=‘species‘)
g.map_diag(plt.hist)
g.map_offdiag(plt.scatter)
g.add_legend()
plt.show()
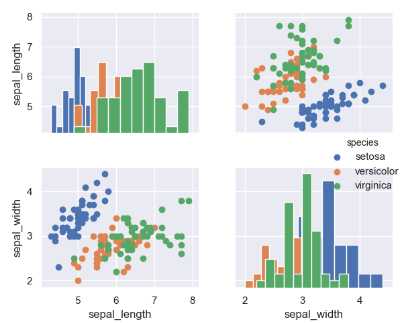
11. 只取其中的两个属性进行画图vars()
g = sns.PairGrid(iris, hue=‘species‘, vars=[‘sepal_length‘, ‘sepal_width‘])
g.map_diag(plt.hist)
g.map_offdiag(plt.scatter)
g.add_legend()
plt.show()
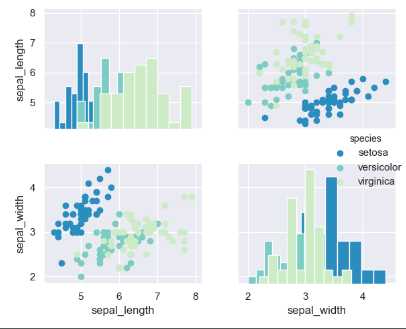
12. palette=‘green_d‘ 使用渐变色进行画图,取的颜色是整数的
g = sns.PairGrid(iris, hue=‘species‘, vars=[‘sepal_length‘, ‘sepal_width‘], palette=‘GnBu_r‘)
g.map_diag(plt.hist)
g.map_offdiag(plt.scatter)
g.add_legend()
plt.show()
标签:第五天 hue pair idt 散点图 cat white code ica
原文地址:https://www.cnblogs.com/my-love-is-python/p/10246428.html