标签:info too html 换行 jquer form show rgba 雷达
<!DOCTYPE html>
<html>
    <head>
        <meta charset="utf-8" />
        <title></title>
    </head>
    <body>
        哈哈哈
        <div id="chartmain" style="width:600px; height: 400px;"></div>
    </body>
    <script type="text/javascript" src="js/jquery-3.3.1.min.js"></script>
    <script type="text/javascript" src="js/echarts.js"></script>
    <script>

option = {
    title: {
        //标题相对x、y轴的位置
        x: ‘center‘,
        y: ‘bottom‘,
        text: ‘ECharts例子个数统计‘,
        subtext: ‘Rainbow bar example‘,
        link: ‘http://echarts.baidu.com/doc/example.html‘
    },
    // 鼠标滑过柱状图显示值
    tooltip: {
        trigger: ‘item‘
    },
    // 右上角工具按钮
    toolbox: {
        show: true,
        feature: {
            dataView: {show: true, readOnly: false},
            restore: {show: true},
            saveAsImage: {show: true}
        }
    },
    calculable: true,
    grid: {
        borderWidth: 0,
        y: 80,
        y2: 60
    },
    xAxis: [
        {
            type: ‘category‘,
            //x轴不显示(在鼠标滑过时,会显示在值前面)
            show: false,
            data: [‘Line‘, ‘Bar‘, ‘Scatter‘, ‘K‘, ‘Pie‘, ‘Radar‘, ‘Chord‘, ‘Force‘, ‘Map‘, ‘Gauge‘, ‘Funnel‘]
        }
    ],
    yAxis: [
        {
            type: ‘value‘,
            show: false
        }
    ],
    series: [
        {
            name: ‘ECharts例子个数统计‘,
            type: ‘bar‘,
            //定义每个bar的颜色和其上是否显示值
            itemStyle: {
                normal: {
                    color: function(params) {
                        // build a color map as your need.
                        //定义一个颜色集合
                        var colorList = [
                          ‘#C1232B‘,‘#B5C334‘,‘#FCCE10‘,‘#E87C25‘,‘#27727B‘,
                           ‘#FE8463‘,‘#9BCA63‘,‘#FAD860‘,‘#F3A43B‘,‘#60C0DD‘,
                           ‘#D7504B‘,‘#C6E579‘,‘#F4E001‘,‘#F0805A‘,‘#26C0C0‘
                        ];
                        //对每个bar显示一种颜色
                        return colorList[params.dataIndex]
                    },
                    label: {
                        //每个bar的最高点值显示在bar顶部
                        show: true,
                        position: ‘top‘,
                        //值和x轴分类的显示格式(这里是换行显示)
                        formatter: ‘{b}\n{c}‘
                    }
                }
            },
            data: [12,21,10,4,12,5,6,5,25,23,7],
            markPoint: {
                tooltip: {
                    trigger: ‘item‘,
                    backgroundColor: ‘rgba(0,0,0,0)‘,
                    formatter: function(params){
                        return ‘<img src="‘
                                + params.data.symbol.replace(‘image://‘, ‘‘)
                                + ‘"/>‘;
                    }
                },
                data: [
                    {xAxis:0, y: 350, name:‘Line‘, symbolSize:20, symbol: ‘image://../asset/ico/折线图.png‘},
                    {xAxis:1, y: 350, name:‘Bar‘, symbolSize:20, symbol: ‘image://../asset/ico/柱状图.png‘},
                    {xAxis:2, y: 350, name:‘Scatter‘, symbolSize:20, symbol: ‘image://../asset/ico/散点图.png‘},
                    {xAxis:3, y: 350, name:‘K‘, symbolSize:20, symbol: ‘image://../asset/ico/K线图.png‘},
                    {xAxis:4, y: 350, name:‘Pie‘, symbolSize:20, symbol: ‘image://../asset/ico/饼状图.png‘},
                    {xAxis:5, y: 350, name:‘Radar‘, symbolSize:20, symbol: ‘image://../asset/ico/雷达图.png‘},
                    {xAxis:6, y: 350, name:‘Chord‘, symbolSize:20, symbol: ‘image://../asset/ico/和弦图.png‘},
                    {xAxis:7, y: 350, name:‘Force‘, symbolSize:20, symbol: ‘image://../asset/ico/力导向图.png‘},
                    {xAxis:8, y: 350, name:‘Map‘, symbolSize:20, symbol: ‘image://../asset/ico/地图.png‘},
                    {xAxis:9, y: 350, name:‘Gauge‘, symbolSize:20, symbol: ‘image://../asset/ico/仪表盘.png‘},
                    {xAxis:10, y: 350, name:‘Funnel‘, symbolSize:20, symbol: ‘image://../asset/ico/漏斗图.png‘},
                ]
            }
        }
    ]
};


        //初始化echarts实例
        var myChart = echarts.init(document.getElementById(‘chartmain‘));
        //使用制定的配置项和数据显示图表
        myChart.setOption(option);
    </script>
</html>
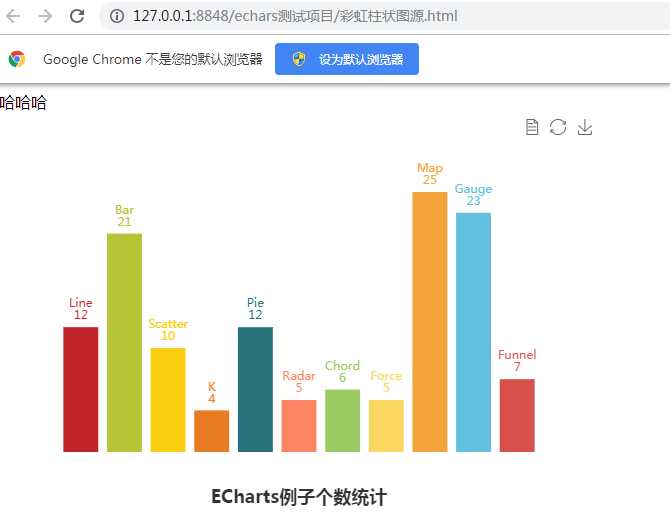
效果:
上面是普通柱状图每个bar显示不同颜色的方法。
下面是分组柱状图,不同图例类型显示不同 自定义颜色 的设置方法:
echarts彩虹柱状图 每个bar显示不同颜色, 标题在不同位置 ,工具中有可以直接保存为图片下载
标签:info too html 换行 jquer form show rgba 雷达
原文地址:https://www.cnblogs.com/libin6505/p/10341754.html