标签:ext 逗号 边框 返回 字符 ref round 添加 att
import matplotlib.pyplot as plt
import numpy as np
#使用np.linspace定义x:范围是(-1,1);个数是50. 仿真一维数据组(x ,y)表示曲线1.

# 使用plt.figure定义一个图像窗口. 使用plt.plot画(x ,y)曲线. 使用plt.show显示图像.
x = np.linspace(-1, 1, 50)
y = 2*x + 1
plt.figure()
plt.plot(x, y)
plt.show()
#figure 图像
#简单的线条
#matplotlib 的 figure 就是一个 单独的 figure 小窗口, 小窗口里面还可以有更多的小图片.

#使用import导入模块matplotlib.pyplot,并简写成plt 使用import导入模块numpy,并简写成np
import matplotlib.pyplot as plt
import numpy as np
#使用np.linspace定义x:范围是(-3,3);个数是50. 仿真一维数据组(x ,y1)表示曲线1. 仿真一维数据组(x ,y2)表示曲线2.
x = np.linspace(-3, 3, 50)
y1 = 2*x + 1
y2 = x**2

#使用plt.figure定义一个图像窗口. 使用plt.plot画(x ,y1)曲线.
plt.figure()
plt.plot(x, y1)
plt.show()
#使用plt.figure定义一个图像窗口:编号为3;大小为(8, 5). 使用plt.plot画(x ,y2)曲线. 使用plt.plot画(x ,y1)曲线,曲线的颜色属性(color)为红色;曲线的宽度(linewidth)为1.0;曲线的类型(linestyle)为虚线. 使用plt.show显示图像.

plt.figure(num=3, figsize=(8, 5),)
plt.plot(x, y2)
plt.plot(x, y1, color=‘red‘, linewidth=1.0, linestyle=‘--‘)
plt.show()
在 matplotlib 中如何设置坐标轴的范围, 单位长度, 替代文字等等.
调整名字和间隔
# 设置坐标轴1

# 在 matplotlib 中如何设置坐标轴的范围, 单位长度, 替代文字等等.
# 调整名字和间隔
# 使用import导入模块matplotlib.pyplot,并简写成plt 使用import导入模块numpy,并简写成np

import matplotlib.pyplot as plt
import numpy as np
# 使用np.linspace定义x:范围是(-3,3);个数是50.
# 仿真一维数据组(x ,y1)表示曲线1. 仿真一维数据组(x ,y2)表示曲线2.

# 使用plt.figure定义一个图像窗口. 使用plt.plot画(x ,y2)曲线. 使用plt.plot画(x ,y1)曲线,
# 曲线的颜色属性(color)为红色;曲线的宽度(linewidth)为1.0;曲线的类型(linestyle)为虚线.
plt.figure()
x = np.linspace(-3, 3, 50)
y1 = 2*x + 1
y2 = x**2
plt.figure()
plt.plot(x, y2)
plt.plot(x, y1, color=‘red‘, linewidth=1.0, linestyle=‘--‘)
#使用plt.xlim设置x坐标轴范围:(-1, 2); 使用plt.ylim设置y坐标轴范围:(-2, 3);
#使用plt.xlabel设置x坐标轴名称:’I am x’; 使用plt.ylabel设置y坐标轴名称:’I am y’;

plt.xlim((-1, 2))
plt.ylim((-2, 3))
plt.xlabel(‘I am x‘)
plt.ylabel(‘I am y‘)
x = np.linspace(-3, 3, 50)
y1 = 2*x + 1
y2 = x**2

plt.plot(x, y2)
plt.plot(x, y1, color=‘red‘, linewidth=1.0, linestyle=‘--‘)
# 使用np.linspace定义范围以及个数:范围是(-1,2);个数是5.
# 使用print打印出新定义的范围. 使用plt.xticks设置x轴刻度:范围是(-1,2);个数是5.

new_ticks = np.linspace(-1, 2, 5)
print(new_ticks)
plt.xticks(new_ticks)
plt.yticks([-2, -1.8, -1, 1.22, 3],[r‘$really\ bad$‘, r‘$bad$‘, r‘$normal$‘, r‘$good$‘, r‘$really\ good$‘])
plt.xlabel(‘I am x‘)
plt.ylabel(‘I am y‘)
y1 = 2*x + 1
y2 = x**2
plt.plot(x, y2)
plt.plot(x, y1, color=‘red‘, linewidth=1.0, linestyle=‘--‘)

plt.show()
这次会说到在我们如何移动matplotlib 中 axis 坐标轴的位置.
设置不同名字和位置
调整坐标轴
设置坐标轴2
#设置不同名字和位置
#使用import导入模块matplotlib.pyplot,并简写成plt 使用import导入模块numpy,并简写成np
import matplotlib.pyplot as plt
import numpy as np
#使用np.linspace定义x:范围是(-3,3);个数是50. 仿真一维数据组(x ,y1)表示曲线1. 仿真一维数据组(x ,y2)表示曲线2.
x = np.linspace(-3, 3, 50)
y1 = 2*x + 1
y2 = x**2

#使用plt.figure定义一个图像窗口. 使用plt.plot画(x ,y2)曲线. 使用plt.plot画(x ,y1)曲线,曲线的颜色属性(color)为红色;曲线的宽度(linewidth)为1.0;曲线的类型(linestyle)为虚线. 使用plt.xlim设置x坐标轴范围:(-1, 2); 使用plt.ylim设置y坐标轴范围:(-2, 3);
plt.figure()
plt.plot(x, y2)
plt.plot(x, y1, color=‘red‘, linewidth=1.0, linestyle=‘--‘)
plt.xlim((-1, 2))
plt.ylim((-2, 3))

#使用np.linspace定义范围以及个数:范围是(-1,2);个数是5. 使用plt.xticks设置x轴刻度:范围是(-1,2);个数是5. 使用plt.yticks设置y轴刻度以及名称:刻度为[-2, -1.8, -1, 1.22, 3];对应刻度的名称为[‘really bad’,’bad’,’normal’,’good’, ‘really good’].
new_ticks = np.linspace(-1, 2, 5)
plt.xticks(new_ticks)
plt.yticks([-2, -1.8, -1, 1.22, 3],[‘$really\ bad$‘, ‘$bad$‘, ‘$normal$‘, ‘$good$‘, ‘$really\ good$‘])

#使用plt.gca获取当前坐标轴信息. 使用.spines设置边框:右侧边框;使用.set_color设置边框颜色:默认白色; 使用.spines设置边框:上边框;使用.set_color设置边框颜色:默认白色;
ax = plt.gca()
ax.spines[‘right‘].set_color(‘none‘)
ax.spines[‘top‘].set_color(‘none‘)
plt.show()
# 调整坐标轴

# 使用.xaxis.set_ticks_position设置x坐标刻度数字或名称的位置:bottom.(所有位置:top,bottom,both,default,none)

ax.xaxis.set_ticks_position(‘bottom‘)
#使用.spines设置边框:x轴;使用.set_position设置边框位置:y=0的位置;(位置所有属性:outward,axes,data)

把X轴移动到y=0的位置
ax.spines[‘bottom‘].set_position((‘data‘, 0))
plt.show()
#使用.yaxis.set_ticks_position设置y坐标刻度数字或名称的位置:left.(所有位置:left,right,both,default,none)

ax.yaxis.set_ticks_position(‘left‘)
#使用.spines设置边框:y轴;使用.set_position设置边框位置:x=0的位置;(位置所有属性:outward,axes,data) 使用plt.show显示图像.
ax.spines[‘left‘].set_position((‘data‘,0))
plt.show()
Legend 图例
# 添加图例
# matplotlib 中的 legend 图例就是为了帮我们展示出每个数据对应的图像名称. 更好的让读者认识到你的数据结构.

import matplotlib.pyplot as plt
import numpy as np

x = np.linspace(-3, 3, 50)
y1 = 2*x + 1
y2 = x**2

plt.figure()
#set x limits
plt.xlim((-1, 2))
plt.ylim((-2, 3))

# set new sticks
new_sticks = np.linspace(-1, 2, 5)
plt.xticks(new_sticks)
# set tick labels
plt.yticks([-2, -1.8, -1, 1.22, 3],
           [r‘$really\ bad$‘, r‘$bad$‘, r‘$normal$‘, r‘$good$‘, r‘$really\ good$‘])

# 本节中我们将对图中的两条线绘制图例,首先我们设置两条线的类型等信息(蓝色实线与红色虚线).
# set line syles
l1, = plt.plot(x, y1, label=‘linear line‘)
l2, = plt.plot(x, y2, color=‘red‘, linewidth=1.0, linestyle=‘--‘, label=‘square line‘)

#legend将要显示的信息来自于上面代码中的 label. 所以我们只需要简单写下一下代码, plt 就能自动的为我们添加图例.

#参数 loc=‘upper right‘ 表示图例将添加在图中的右上角.
plt.legend(loc=‘upper right‘)
#调整位置和名称
#如果我们想单独修改之前的 label 信息, 给不同类型的线条设置图例信息. 我们可以在 plt.legend 输入更多参数. 如果以下面这种形式添加 legend, 我们需要确保, 在上面的代码 plt.plot(x, y2, label=‘linear line‘) 和 plt.plot(x, y1, label=‘square line‘) 中有用变量 l1 和 l2 分别存储起来. 而且需要注意的是 l1, l2,要以逗号结尾, 因为plt.plot() 返回的是一个列表.
plt.legend(handles=[l1, l2], labels=[‘up‘, ‘down‘],  loc=‘best‘)
#这样我们就能分别重新设置线条对应的 label 了.

#最后我们得到带有图例信息的图片.

#其中’loc’参数有多种,’best’表示自动分配最佳位置,其余的如下:

 ‘best‘ : 0,
 ‘upper right‘  : 1,
 ‘upper left‘   : 2,
 ‘lower left‘   : 3,
 ‘lower right‘  : 4,
 ‘right‘        : 5,
 ‘center left‘  : 6,
 ‘center right‘ : 7,
 ‘lower center‘ : 8,
 ‘upper center‘ : 9,
 ‘center‘       : 10,
在图片中添加注解
画出基本图
移动坐标
添加注释 annotate
添加注释 text
# Annotation 标注
# 画出基本图

#当图线中某些特殊地方需要标注时,我们可以使用 annotation. matplotlib 中的 annotation 有两种方法,
#一种是用 plt 里面的 annotate,一种是直接用 plt 里面的 text 来写标注.

#首先,我们在坐标轴中绘制一条直线.

import matplotlib.pyplot as plt
import numpy as np

x = np.linspace(-3, 3, 50)
y = 2*x + 1

plt.figure(num=1, figsize=(8, 5),)
plt.plot(x, y,)
# 移动坐标
# 然后我们挪动坐标轴的位置.
ax = plt.gca()
ax.spines[‘right‘].set_color(‘none‘)
ax.spines[‘top‘].set_color(‘none‘)
ax.spines[‘top‘].set_color(‘none‘)
ax.xaxis.set_ticks_position(‘bottom‘)
# 把x轴移动到y=0
ax.spines[‘bottom‘].set_position((‘data‘, 0))
ax.yaxis.set_ticks_position(‘left‘)
# 把y轴移动到x=0的地方
ax.spines[‘left‘].set_position((‘data‘, 0))
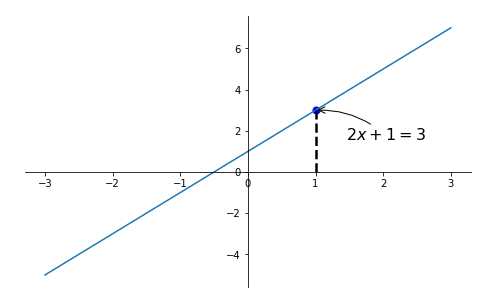
# 然后标注出点(x0, y0)的位置信息.
# 用plt.plot([x0, x0,], [0, y0,], ‘k--‘, linewidth=2.5) 画出一条垂直于x轴的虚线.

x0 = 1
y0 = 2*x0 + 1
plt.plot([x0, x0,], [0, y0,], ‘k--‘, linewidth=2.5)
# set dot styles

plt.scatter([x0, ], [y0, ], s=50, color=‘b‘)
# 添加注释 annotate

# 接下来我们就对(x0, y0)这个点进行标注

plt.annotate(r‘$2x+1=%s$‘ % y0, xy=(x0, y0), xycoords=‘data‘, xytext=(+30, -30),
             textcoords=‘offset points‘, fontsize=16,
             arrowprops=dict(arrowstyle=‘->‘, connectionstyle="arc3,rad=.2"))

# 其中参数xycoords=‘data‘ 是说基于数据的值来选位置, xytext=(+30, -30) 和 textcoords=‘offset points‘ 对于标注位置的描述 和 xy 偏差值,
# arrowprops是对图中箭头类型的一些设置.

# 添加注释 text


plt.text(-3.7, 3, r‘$This\ is\ the\ some\ text. \mu\ \sigma_i\ \alpha_t$‘,
         fontdict={‘size‘: 16, ‘color‘: ‘r‘})

#其中-3.7, 3,是选取text的位置, 空格需要用到转字符\ ,fontdict设置文本字体.
生成图形
调整坐标
标签:ext 逗号 边框 返回 字符 ref round 添加 att
原文地址:https://www.cnblogs.com/foremostxl/p/10356386.html