标签:== water 100% echart stack htm short char 去掉
1、问题背景
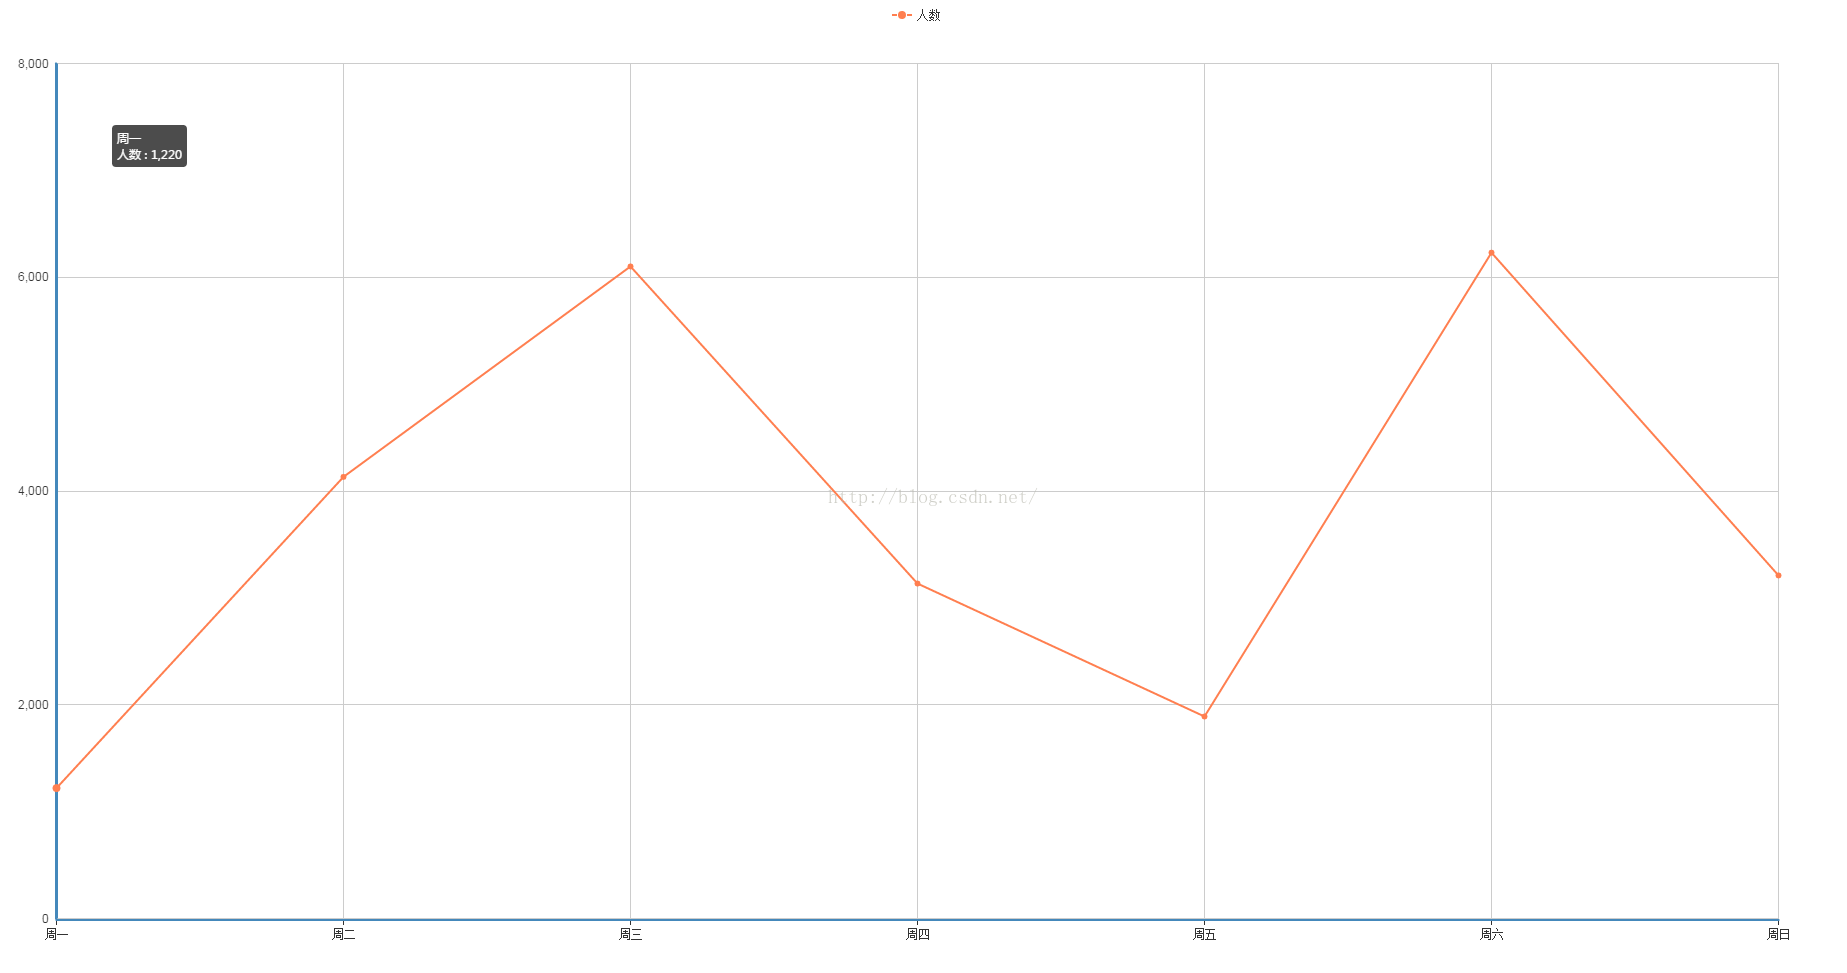
设计一条统计人数的折线,其中网格线没有垂直线
2、实现源码
(1)有垂直网格线
<!DOCTYPE html>
<html>
	<head>
		<meta charset="UTF-8">
		<title>echarts-去掉垂直网格线</title>
		<link rel="shortcut icon" href="../js/echarts-2.2.7/doc/asset/ico/favicon.png">
		<script type="text/javascript" src="../js/echarts-2.2.7/doc/asset/js/jquery.min.js" ></script>
		<script type="text/javascript" src="../js/echarts-2.2.7/doc/example/www2/js/echarts-all.js" ></script>
		<style>
			body,html{
				width: 99%;
				height: 99%;
				font-family: "微软雅黑";
				font-size: 12px;
			}
			#chart{
				width: 100%;
				height: 100%;
			}
		</style>
		<script>
			$(function(){
				var chart = document.getElementById(‘chart‘);
                var echart = echarts.init(chart);

                var option = {
				    title: {
				        text: ‘‘
				    },
				    tooltip: {
				        trigger: ‘axis‘
				    },
				    legend: {
				        data:[‘人数‘]
				    },
				    grid: {
				        left: ‘3%‘,
				        right: ‘4%‘,
				        bottom: ‘3%‘,
				        containLabel: true
				    },
				    toolbox: {
				        feature: {
				            saveAsImage: {}
				        }
				    },
				    xAxis: {
				        type: ‘category‘,
				        boundaryGap: false,
				        data: [‘周一‘,‘周二‘,‘周三‘,‘周四‘,‘周五‘,‘周六‘,‘周日‘]
				    },
				    yAxis: {
				        type: ‘value‘
				    },
				    series: [
				        {
				            name:‘人数‘,
				            type:‘line‘,
				            stack: ‘人数‘,
				            data:[1220, 4132, 6101, 3134, 1890, 6230, 3210]
				        }
				    ]
				};

                echart.setOption(option);
			});
		</script>
	</head>
	<body>
		<div id="chart"></div>
	</body>
</html>
<!DOCTYPE html>
<html>
	<head>
		<meta charset="UTF-8">
		<title>echarts-去掉垂直网格线</title>
		<link rel="shortcut icon" href="../js/echarts-2.2.7/doc/asset/ico/favicon.png">
		<script type="text/javascript" src="../js/echarts-2.2.7/doc/asset/js/jquery.min.js" ></script>
		<script type="text/javascript" src="../js/echarts-2.2.7/doc/example/www2/js/echarts-all.js" ></script>
		<style>
			body,html{
				width: 99%;
				height: 99%;
				font-family: "微软雅黑";
				font-size: 12px;
			}
			#chart{
				width: 100%;
				height: 100%;
			}
		</style>
		<script>
			$(function(){
				var chart = document.getElementById(‘chart‘);
                var echart = echarts.init(chart);

                var option = {
				    title: {
				        text: ‘‘
				    },
				    tooltip: {
				        trigger: ‘axis‘
				    },
				    legend: {
				        data:[‘人数‘]
				    },
				    grid: {
				        left: ‘3%‘,
				        right: ‘4%‘,
				        bottom: ‘3%‘,
				        containLabel: true
				    },
				    toolbox: {
				        feature: {
				            saveAsImage: {}
				        }
				    },
				    xAxis: {
				        type: ‘category‘,
				        boundaryGap: false,
				        splitLine:{
				        	show:false
				        },
				        data: [‘周一‘,‘周二‘,‘周三‘,‘周四‘,‘周五‘,‘周六‘,‘周日‘]
				    },
				    yAxis: {
				        type: ‘value‘
				    },
				    series: [
				        {
				            name:‘人数‘,
				            type:‘line‘,
				            stack: ‘人数‘,
				            data:[1220, 4132, 6101, 3134, 1890, 6230, 3210]
				        }
				    ]
				};

                echart.setOption(option);
			});
		</script>
	</head>
	<body>
		<div id="chart"></div>
	</body>
</html>
(1)有垂直网格线
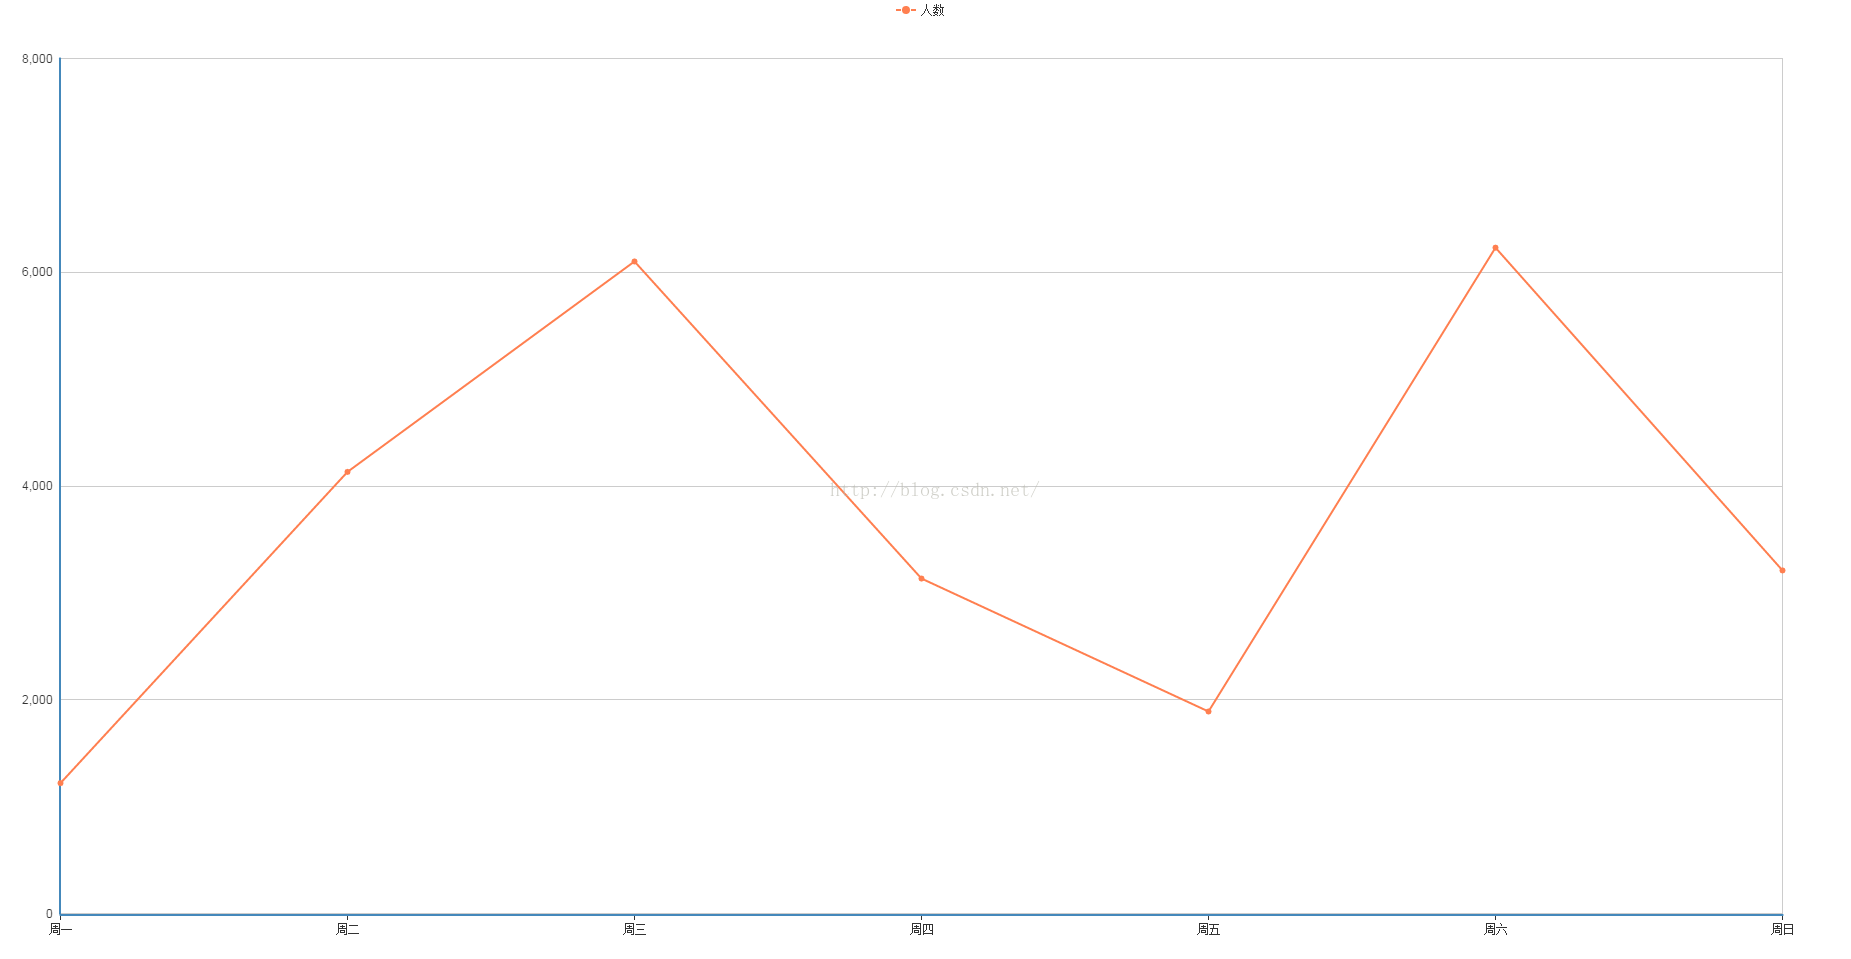
(2)无垂直网格线
4、问题说明
去掉网格中的垂直线,只需在xAxis中加入splitLine属性的设置show:false
再分享一下我老师大神的人工智能教程吧。零基础!通俗易懂!风趣幽默!还带黄段子!希望你也加入到我们人工智能的队伍中来!https://blog.csdn.net/jiangjunshow
标签:== water 100% echart stack htm short char 去掉
原文地址:https://www.cnblogs.com/odejsjhshw/p/10366959.html