标签:pre 风格 字符 alt style png size otl font
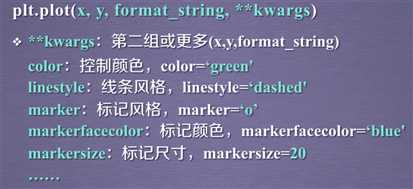
plt.plot(x,y,format_string,**kwargs)
x:X轴数据,列表或数组,可选。当绘制多条曲线时,各条曲线的X不能省略。
y:Y轴数据,列表或数组。
format_string:控制曲线的格式字符串,可选。
**kwargs:第二组或更多(x,y,format_string)
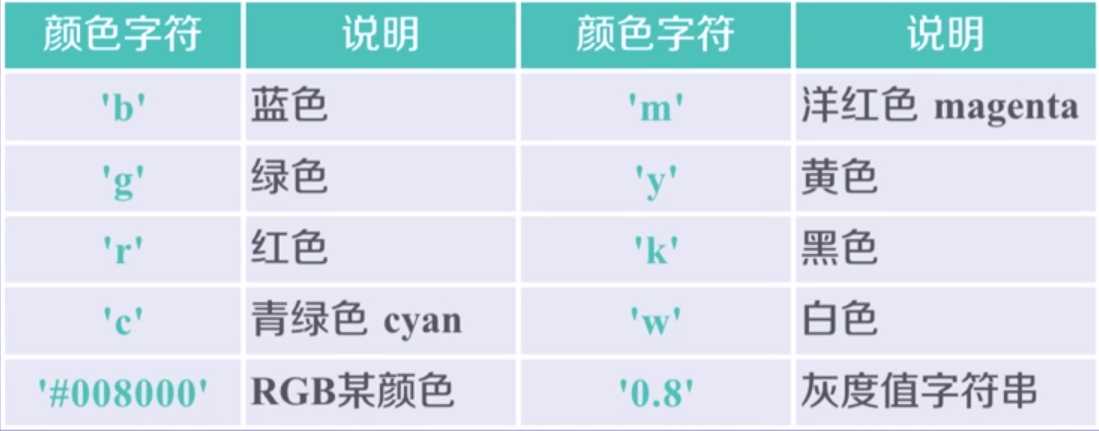
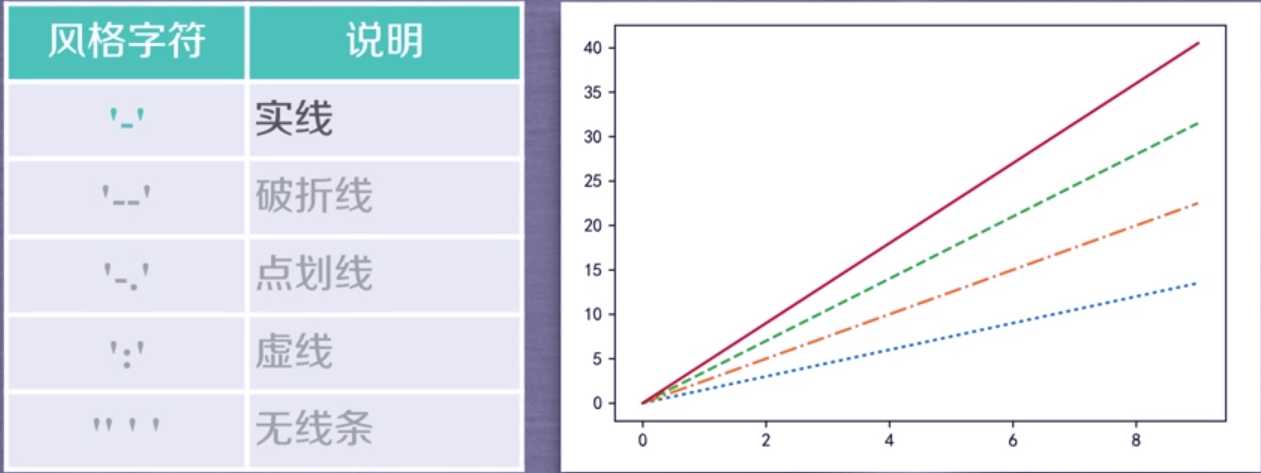
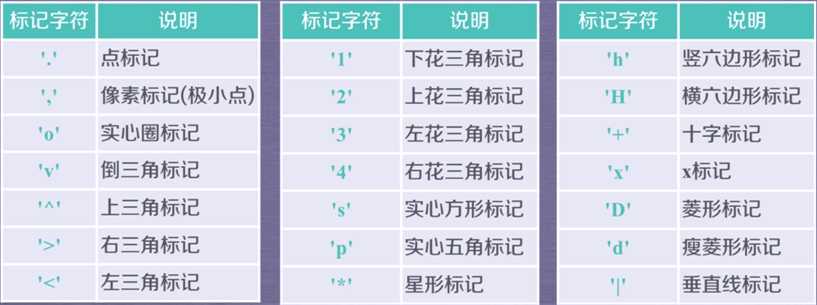
format_string: 由颜色字符、风格字符和标记字符组成。
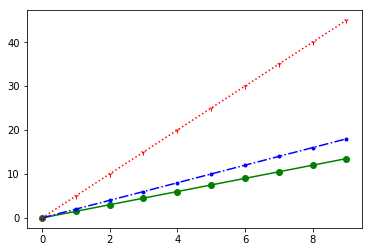
1 import numpy as np
2 import matplotlib.pyplot as plt
3
4 a=np.arange(10)
5 plt.plot(a,a*1.5,‘go-‘,a,a*2,‘b-..‘,a,a*5,‘r1:‘)#格式字符串中的顺序没有要求
6 plt.show()
plt.plot(x,y,format_string,**kwargs)
标签:pre 风格 字符 alt style png size otl font
原文地址:https://www.cnblogs.com/ldyj/p/10381361.html