标签:anti 数据 com 图片 http width figure class 图形
# coding = utf - 8
# 直方图用于那些没有统计过的数据
from matplotlib import pyplot as plt

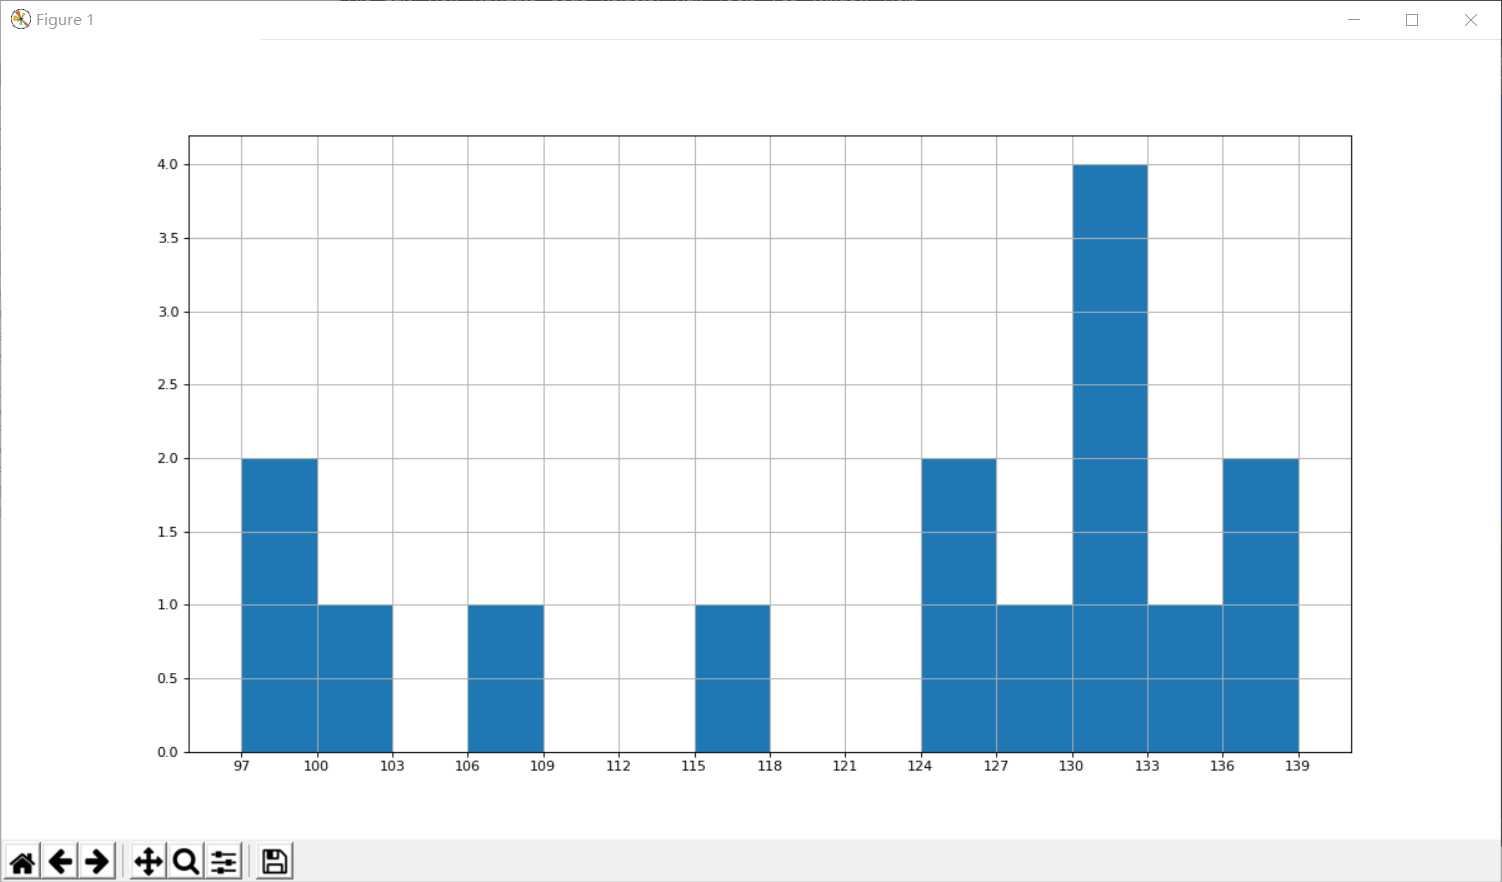
a = [131,98,125,131,124,139,131,117,128,108,135,138,131,102, 97]

# 计算组数
d = 3 # 组距
num_bins = (max(a) - min(a)) // d
print(max(a), min(a), max(a) - min(a))
print(num_bins)

# 设置图形大小
plt.figure(figsize=(15, 8), dpi=80)
# 绘制直方图
plt.hist(a, num_bins)

# 设置x轴的刻度
plt.xticks(range(min(a), max(a) + d, d))

plt.grid()

plt.show()

# coding = utf - 8
from matplotlib import pyplot as plt

interval = [0,5,10,15,20,25,30,35,40,45,60,90]
width = [5,5,5,5,5,5,5,5,5,15,30,60]
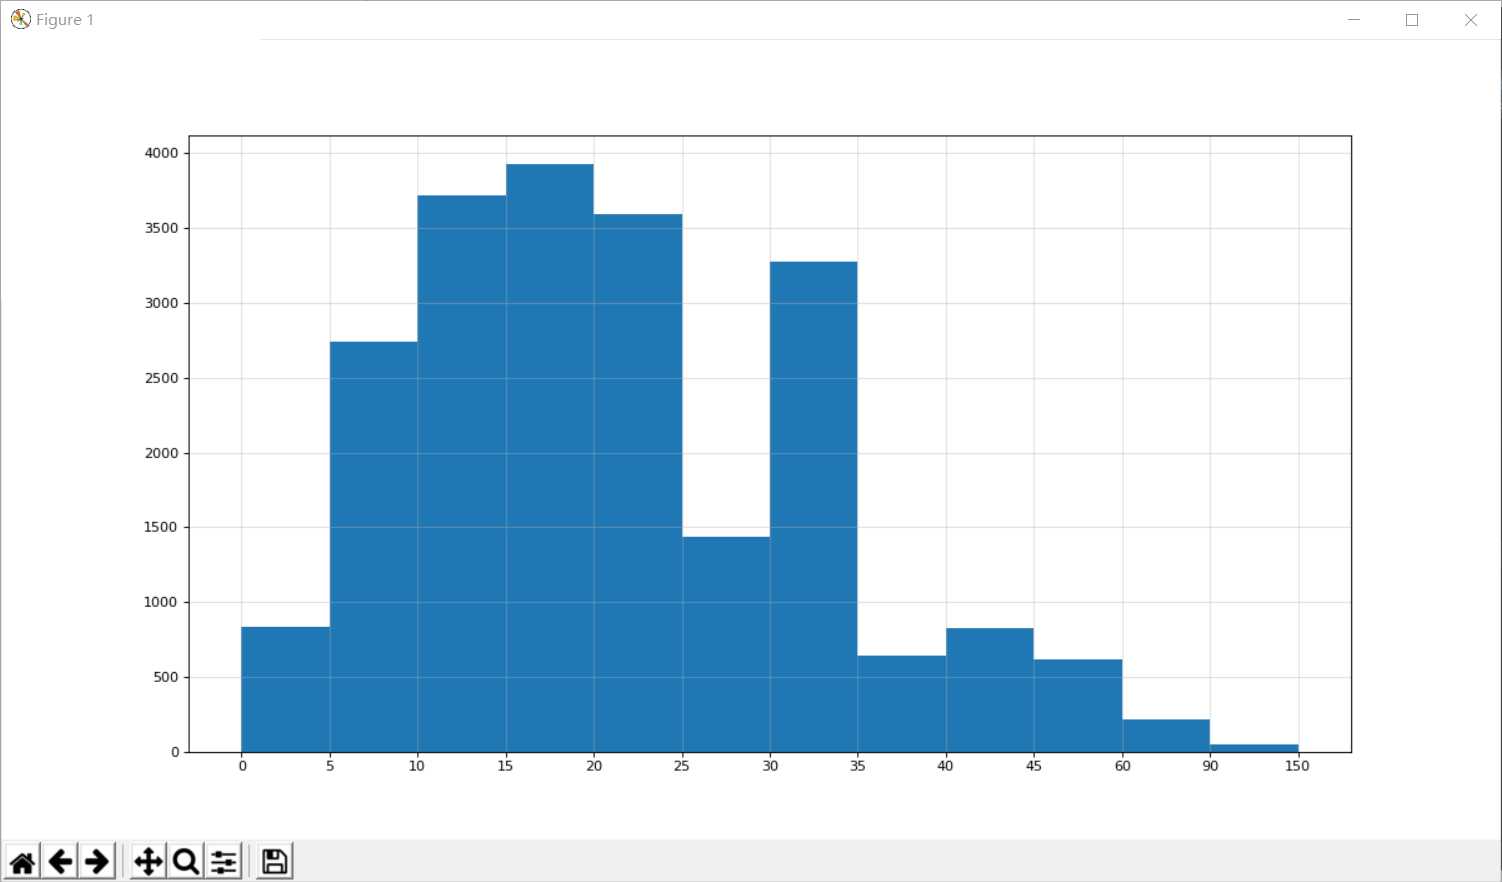
quantity = [836,2737,3723,3926,3596,1438,3273,642,824,613,215,47]

# 设置图片大小
plt.figure(figsize=(15, 8), dpi=80)

plt.bar(range(len(quantity)), quantity, width=1)

# 设置x轴的刻度
_x = [i - 0.5 for i in range(len(quantity) + 1)]
_xtick_labels = interval + [150]
plt.xticks(_x, _xtick_labels)

plt.grid(alpha = 0.4)
plt.show()

标签:anti 数据 com 图片 http width figure class 图形
原文地址:https://www.cnblogs.com/mjn1/p/10666808.html