标签:width 编程语言 效果图 很多 循环 white show 语言 inf
一、库函数介绍
1. numpy库
NumPy(Numeric Python)提供了一个N维的数组类型ndarray,Numpy底层使用C语言编写,内部解除了GIL(全局解释器锁),其对数组的操作速度不受Python解释器的限制,效率远高于纯Python代码。
ndarray到底跟原生python列表的区别:
ndarray中的所有元素的类型都是相同的,而Python列表中的元素类型是任意的,所以ndarray在存储元素时内存可以连续,而python原生list就只能通过寻址方式找到下一个元素,这虽然也导致了在通用性能方面Numpy的ndarray不及Python原生list,但在科学计算中,Numpy的ndarray就可以省掉很多循环语句,代码使用方面比Python原生list简单的多。
2. matplotlib库
matplotlib 是一个 Python 的 2D绘图库,也是Python编程语言及其数值数学扩展包 NumPy的可视化操作界面。它利用通用的图形用户界面工具包,如Tkinter, wxPython, Qt或GTK+向应用程序嵌入式绘图提供了应用程序接口(API)。此外,matplotlib还有一个基于图像处理库(如开放图形库OpenGL)的pylab接口,其设计与MATLAB非常类似--尽管并不怎么好用。SciPy就是用matplotlib进行图形绘制。
二、应用A
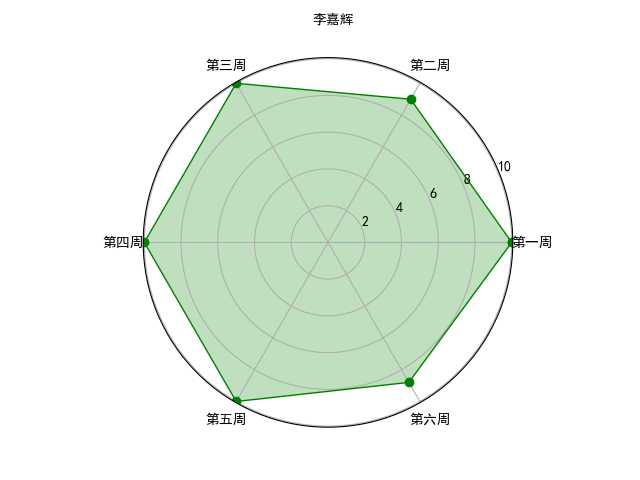
1. 介绍:对python123作业的成绩通过画图显示
2. 代码实现:
# -*- coding:utf-8 -*-
‘‘‘ 成绩雷达图 ‘‘‘
import numpy as np
import matplotlib.pyplot as plt
plt.rcParams[‘font.family‘] = ‘SimHei‘ # 设置字体
plt.rcParams[‘font.sans-serif‘] = [‘SimHei‘] # 设置字体
labels = np.array([‘第一周‘,‘第二周‘,‘第三周‘,‘第四周‘,‘第五周‘,‘第六周‘]) # 设置标签
datas = np.array([10, 9, 10, 10, 10, 8.8]) # 设置数据
angles = np.linspace(0, 2*np.pi, 6, endpoint = False) # 设置角度
datas = np.concatenate((datas, [datas[0]]))
angles = np.concatenate((angles, [angles[0]]))
fig = plt.figure(facecolor = ‘white‘) # 创建绘图区域
plt.subplot(111, polar = True) # 极坐标
plt.plot(angles, datas, ‘bo-‘, color = ‘g‘, linewidth = 1) # 画图
plt.fill(angles, datas, facecolor = ‘g‘, alpha = 0.25) # 填充
plt.thetagrids(angles*180/np.pi, labels) # 设置极坐标的位置
plt.figtext(0.52, 0.95, ‘李嘉辉‘, ha = ‘center‘) # 设置标题
plt.grid(True) # 打开网格线
plt.show() # 展示图片
3. 效果展示:

三、应用B
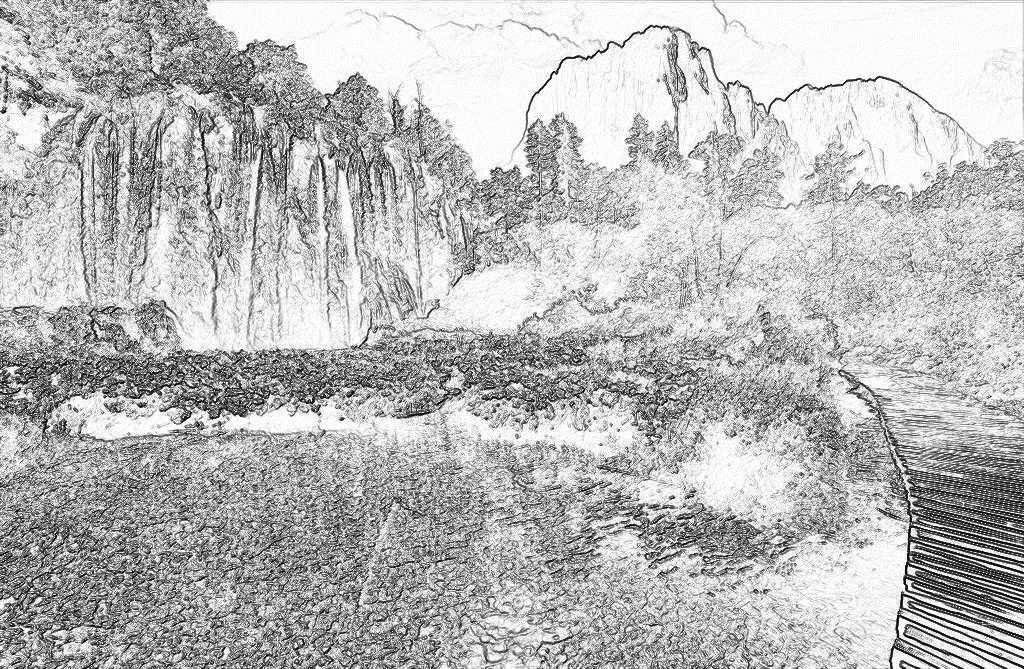
1. 介绍:使用numpy和PIL库实现图像的手绘效果
2. 代码实现:
 1 # -*- coding:utf-8 -*-
 2 ‘‘‘ 手绘图像效果 ‘‘‘
 3 import numpy as np
 4 from PIL import Image
 5 vec_el = np.pi/2.2   # 光源的俯视角度,弧度值
 6 vec_az = np.pi/4.    # 光源的方位角度,弧度值
 7 depth = 6.          # 深度权值,值越小背景区域越接近白色,值越大背景区域越接近黑色
 8 im = Image.open(‘PICTURE\HandMade.jpg‘).convert(‘L‘)     # 打开图像并转变为灰度模式
 9 a = np.asarray(im).astype(‘float‘)
10 grad = np.gradient(a)              # 取图像灰度的梯度值
11 grad_x, grad_y = grad              # 分别取图像的横纵梯度值
12 grad_x = grad_x * depth / 100.
13 grad_y = grad_y * depth / 100.
14 dx = np.cos(vec_el) * np.cos(vec_az) # 光源对x轴的影响
15 dy = np.cos(vec_el) * np.sin(vec_az) # 光源对y轴的影响
16 dz = np.sin(vec_el)                  # 光源对z轴的影响
17 A = np.sqrt(grad_x**2 + grad_y**2 + 1.)
18 uni_x = grad_x/A
19 uni_y = grad_y/A
20 uni_z = 1./A
21 a2 = 255*(dx * uni_x + dy * uni_y + dz * uni_z) # 光源归一化
22 a2 = a2.clip(0, 255)                 # 预防溢出
23 im2 = Image.fromarray(a2.astype(‘uint8‘))       # 重构图像
24 im2.save(‘HandMade_.jpg‘) # 保存图像
25 im2.show()                # 显示图像
3. 效果展示:
原图 效果图


四、应用C
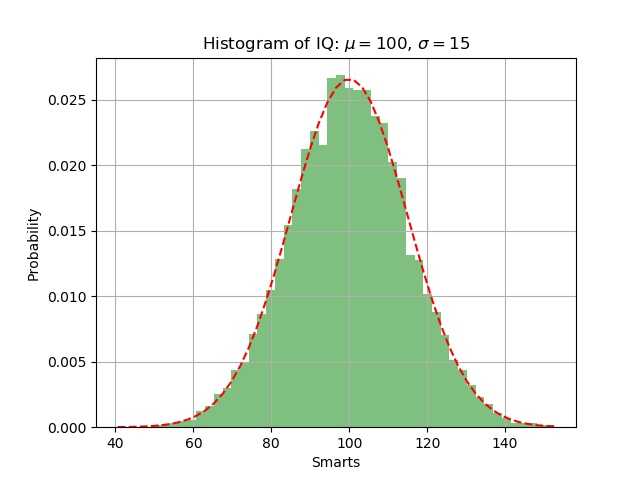
1. 简介:用numpy和matplotlib展现数学模型 —— 正态分布
2. 代码实现:
 1 # -*- coding:utf-8 -*-
 2 ‘‘‘ 正态分布 ‘‘‘
 3 import numpy as np
 4 import matplotlib.mlab as mlab
 5 import matplotlib.pyplot as plt
 6
 7 dx = 100           # 正态分布的均值
 8 sigma = 15         # 标准差
 9 x = dx + sigma * np.random.randn(10000)  # 在均值周围产生符合正态分布的x值
10
11 num_bins = 50
12 n, bins, patches = plt.hist(x, num_bins, normed=1, facecolor=‘green‘, alpha=0.5)
13 # 直方图函数,x为x轴的值,normed=1表示为概率密度,即和为一,绿色方块,色深参数0.5.返回n个概率,直方块左边线的x值,及各个方块对象
14 y = mlab.normpdf(bins, dx, sigma)        # 画一条逼近的曲线
15 plt.plot(bins, y, ‘r--‘)
16 plt.xlabel(‘Smarts‘)                     # x轴标签
17 plt.ylabel(‘Probability‘)                # y轴标签
18 plt.title(r‘Histogram of IQ: $\mu=100$, $\sigma=15$‘) # 中文标题
19
20 plt.subplots_adjust(left=0.15)           # 左边距
21 plt.grid(True)      # 打开网格线
22 plt.show()          # 显示图片
3. 效果展示:

标签:width 编程语言 效果图 很多 循环 white show 语言 inf
原文地址:https://www.cnblogs.com/ljh463089611/p/10765830.html