标签:end UNC for width mat col details alt text
circle.m(画二维圆的函数)
%该函数是画二维圆圈,输入圆心坐标和半径
%rectangle()函数参数‘linewidth’修饰曲线的宽度
%‘edgecolor‘,‘r‘,edgecolor表示边框颜色,r表示颜色参数
%‘facecolor‘,‘b‘,facecolor表示内部填充颜色,b表示颜色参数
function [] = circle( x,y,r )
rectangle(‘Position‘,[x-r,y-r,2*r,2*r],‘Curvature‘,[1,1],‘linewidth‘,1);
axis equal;
end
draw_arrow.m(画两坐标点之间箭头的函数)
%该函数是画从一坐标点到另一坐标点的指向箭头
function draw_arrow(start_point, end_point)
% 从start_point到end_point画一箭头
K = 0.05; %箭头比例系数
theta = pi / 8; %箭头角度
A1 = [cos(theta), -sin(theta);
sin(theta), cos(theta)]; %旋转矩阵
theta = -theta;
A2 = [cos(theta), -sin(theta);
sin(theta), cos(theta)]; %旋转矩阵
arrow = start_point‘ - end_point‘;
arrow_1 = A1 * arrow;
arrow_2 = A2 * arrow;
arrow_1 = K * arrow_1 + end_point‘;
arrow_2 = K * arrow_2 + end_point‘;
hold on;
grid on;
axis equal;
plot([start_point(1), end_point(1)], [start_point(2), end_point(2)], ‘k‘);
plot([arrow_1(1), end_point(1)], [arrow_1(2), end_point(2)], ‘k‘);
plot([arrow_2(1), end_point(1)], [arrow_2(2), end_point(2)], ‘k‘);
hold off;
read_file.m(主函数)
clear;
close all;
clc;
%importdata 函数允许加载各种数据的不同格式的文件
data=importdata(‘data.csv‘); %读取csv数据文件
%disp(data); %disp函数:显示文本或数组
for i=1:75
if i<=7
x=data(i,1);
y=data(i,2);
plot(x,y,‘rs‘),axis([0 400 0 800]);
hold on;
else
x=data(i,1);
y=data(i,2);
plot(x,y,‘g.‘),axis([0 400 0 800]);
hold on;
end
end
xlabel(‘x/km‘),ylabel(‘y/km‘); %添加标签
hold on;
%grid on;%添加网格
circle(data(8,1),data(8,2),70); %调用画圆圈的函数
circle(data(18,1),data(18,2),70);
circle(data(27,1),data(27,2),70);
circle(data(32,1),data(32,2),70);
circle(data(42,1),data(42,2),70);
circle(data(49,1),data(49,2),70);
circle(data(55,1),data(55,2),70);
circle(data(61,1),data(61,2),70);
circle(data(66,1),data(66,2),70);
circle(data(71,1),data(71,2),70);
draw_arrow([data(55,1), data(55,2)],[data(66,1), data(66,2)]); %调用画箭头的函数
draw_arrow([data(3,1), data(3,2)],[data(66,1), data(66,2)]);
axis([-100 400 0 800]);
hold on;
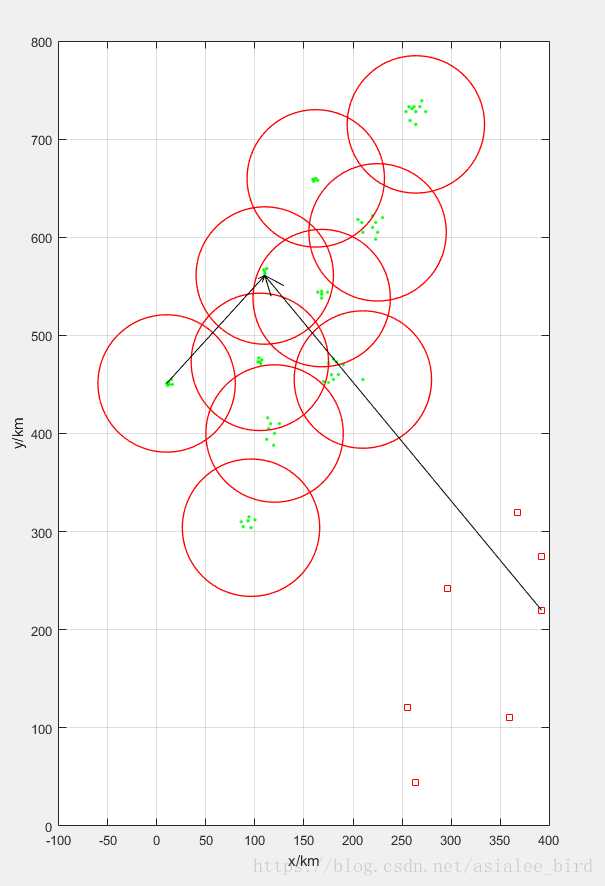
结果为:
data.csv数据如下(位置的坐标):
368,319
264,44
392,220
360,110
392,275
296,242
256,121
264,715
258,719
274,728
264,728
254,728
257,733
260,731
262,733
268,733
270,739
225,605
223,598
210,605
220,610
223,615
209,615
230,620
220,622
205,618
168,538
168,542
164,544
168,545
174,544
210,455
180,455
175,452
170,453
185,460
178,460
190,470
183,473
175,472
180,476
120,400
119,388
112,394
125,410
114,405
116,410
113,416
96,304
88,305
100,312
93,311
86,310
94,315
10,451
11,449
13,450
16,450
12,453
15,455
162,660
161,659
159,659
160,657
164,658
110,561
110,563
110,565
109,567
112,568
105,473
106,471
103,473
107,475
104,477
附加:
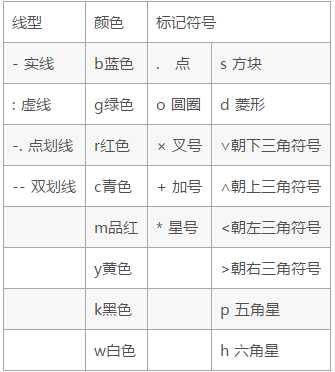
plot函数
Matlab提供了一些绘图选项,用于确定所绘曲线的线型、颜色和数据点标记符号。这些选项如表所示:
参考:
1、matlab详细绘图
2、matlab教程
---------------------
作者:Asia-Lee
来源:CSDN
原文:https://blog.csdn.net/asialee_bird/article/details/80286591
版权声明:本文为博主原创文章,转载请附上博文链接!
标签:end UNC for width mat col details alt text
原文地址:https://www.cnblogs.com/rainbow70626/p/10776746.html