标签:模型 nbsp 增加 figure 单元 卷积 for com abs
%对混响的理解有帮助
%无多普勒频移的海底混响单元散射模型卷积法
clc;clear all;close all;
%参数设置============================================================
fs=200000; %采样频率
f0=30000; %中心频率
%k=1250000; %k =B/t =5kHz/4ms
B=5000;
c=1500; %声速
h=50; %距海底距离
u=-27;
rou=1; %密度
v=20;
azm=pi/6; %声纳水平方位角
startt=0.08; %混响起始时间
endt=0.3; %混响终止时间
T=0.005;%脉冲宽度
ts=0:1/fs:T-1/fs;%脉冲时间序列
s1=exp(j*2.*pi.*f0.*ts); %CW信号
k=B/T; %1000000
s2=exp(j*2.*pi.*(f0-B/2).*ts+j*pi.*k.*ts.*ts); %LFM信号
Ns=length(ts);%Ns 1000个点
k1=2*pi*f0/c;%波数 125.6637
k2=2*pi*(f0-B/2+k*ts)/c; %1*1000
% 信号时域=======================================================================
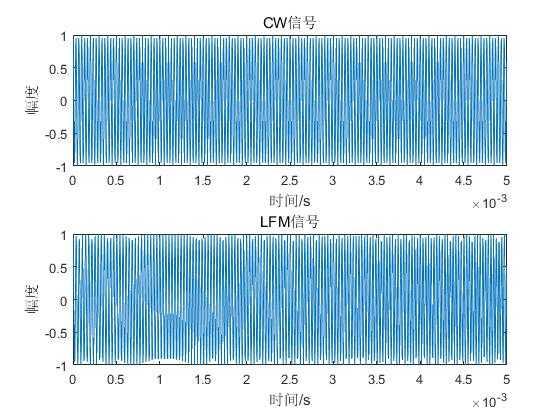
figure(1);
subplot(2,1,1);
plot(ts,real(s1));%取复信号的实部进行画图,如不取实部,系统自动取实部
axis([0 0.005 -1 1]); %axis([xmin xmax ymin ymax]),单轴xlim([0 5])
xlabel(‘时间/s‘);ylabel(‘幅度‘);title(‘CW信号‘);
subplot(2,1,2);
plot(ts,real(s2));
axis([0 0.005 -1 1]);xlabel(‘时间/s‘);ylabel(‘幅度‘);title(‘LFM信号‘);
%信号频谱=================================================================
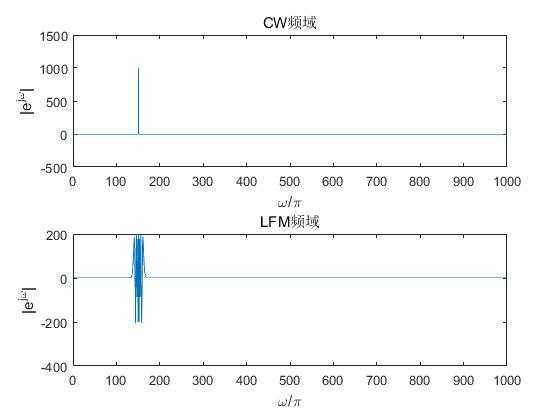
s1_fft=fft(s1);
s2_fft=fft(s2);
figure(2);
subplot(211);plot(1:length(s1_fft),s1_fft);xlabel(‘\omega/\pi‘);ylabel(‘|e^j^\omega|‘);title(‘CW频域‘);
subplot(212);plot(1:length(s2_fft),s2_fft);xlabel(‘\omega/\pi‘);ylabel(‘|e^j^\omega|‘);title(‘LFM频域‘);
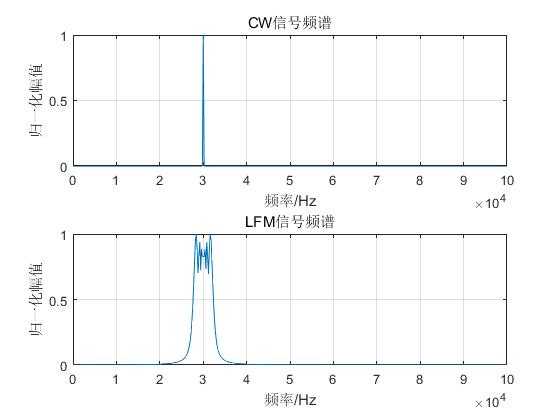
X1=abs(fft(s1));%对复信号进行傅里叶变换,然后取模
X2=abs(fft(s2));
X1=X1/max(X1);
X2=X2/max(X2);
figure(3);
subplot(2,1,1);
f=fs*(0:Ns/2)/Ns;
plot(f,X1(1:Ns/2+1));
xlabel(‘频率/Hz‘);ylabel(‘归一化幅值‘);title(‘CW信号频谱‘);grid on;%添加网格
subplot(2,1,2);
f=fs*(0:Ns/2)/Ns;
plot(f,X2(1:Ns/2+1));
xlabel(‘频率/Hz‘);ylabel(‘归一化幅值‘);title(‘LFM信号频谱‘);grid on;
%===============================================================
%散射特征函数=============================================
Np=(endt-startt)*fs; %散射系数的点数24000个点,发射信号持续时间内采样的点
for th=startt:1/fs:endt-1/fs %混响时间 Np24000个点,th共循环44000次
r2=c*th/2; %c=1500
r1=c*(th-T)/2; %T=0.005
N=round((r2^2-r1^2)*azm/2); %azm=0.5236(pi/6)方位角
%%N=As*rou;
%%A=1;%发射信号的信号强度
%th=0.08,r2=60,r1=56.25,N=114;...........th=0.3,r2=224.9963,r1=221.2463,N=438
%随着混响时间的增加,混响点数也在增加
ain=randn(1,N); %th=0.08时,产生114个随机数
fai=randn(1,N)*2*pi; %th=0.08时,产生114个随机相位
for i=1:N
p1(i)=ain(i)*exp(j*fai(i)); %th=0.08时,产生114个信号点
p2(i)=ain(i)*exp(j*fai(i)); % th=0.08时,产生114个信号点
end
P1(round((th-startt)*fs)+1)=sum(p1)/r1^2;% 散射系数的时间序列 %P1共44000个点
P2(round((th-startt)*fs)+1)=sum(p2)/r1^2;
end
% 得到混响信号
R1=conv(s1,P1);%44000+1000-1 %1x44999
R2=conv(s2,P2);
Rr1=real(R1);
Rr2=real(R2);
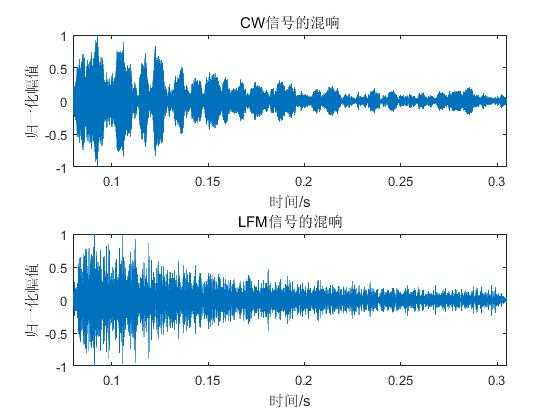
figure(4);
subplot(2,1,1);
%%t=(0:Ns+Np-2)/fs;
t=startt:1/fs:endt+T-2/fs;%: 共44999个点
plot(t,Rr1/max(Rr1));
axis([startt endt+T-2/fs -1 1]);xlabel(‘时间/s‘);ylabel(‘归一化幅值‘);title(‘CW信号的混响‘);
subplot(2,1,2);
plot(t,Rr2/max(Rr2));
axis([startt endt+T-2/fs -1 1]);xlabel(‘时间/s‘);ylabel(‘归一化幅值‘);title(‘LFM信号的混响‘);
%=============================================================
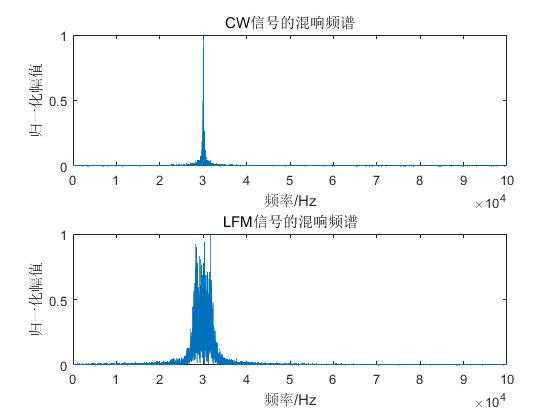
%混响频谱================================================
F1=abs(fft(Rr1));
F2=abs(fft(Rr2));
figure(5);
subplot(2,1,1);
f1=fs*(0:(Ns+Np)/2)/(Ns+Np-1); %1*22500
plot(f1,F1(1:(Ns+Np)/2+1)/max(F1));xlabel(‘频率/Hz‘);ylabel(‘归一化幅值‘);title(‘CW信号的混响频谱‘);
subplot(2,1,2);
f2=fs*(0:(Ns+Np)/2)/(Ns+Np-1); %1*22500
plot(f2,F2(1:(Ns+Np)/2+1)/max(F2));xlabel(‘频率/Hz‘);ylabel(‘归一化幅值‘);title(‘LFM信号的混响频谱‘);
%===============================================================
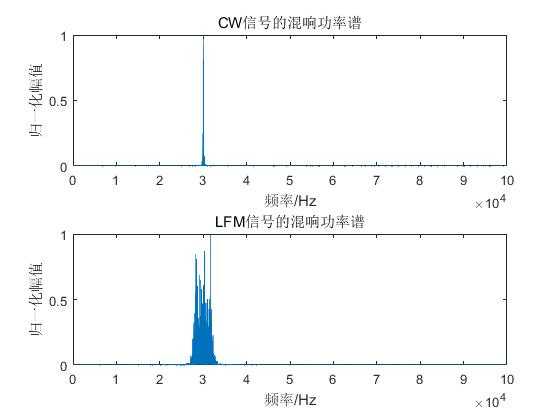
%混响功率谱==========================================================
P1=fft(Rr1).*conj(fft(Rr1))/(Ns+Np-1);
P2=fft(Rr2).*conj(fft(Rr2))/(Ns+Np-1);
figure(6);
subplot(2,1,1);
plot(f1,P1(1:(Ns+Np)/2+1)/max(P1));
xlabel(‘频率/Hz‘);ylabel(‘归一化幅值‘);title(‘CW信号的混响功率谱‘);
subplot(2,1,2);
plot(f2,P2(1:(Ns+Np)/2+1)/max(P2));
xlabel(‘频率/Hz‘);ylabel(‘归一化幅值‘);title(‘LFM信号的混响功率谱‘);
%=====================================================
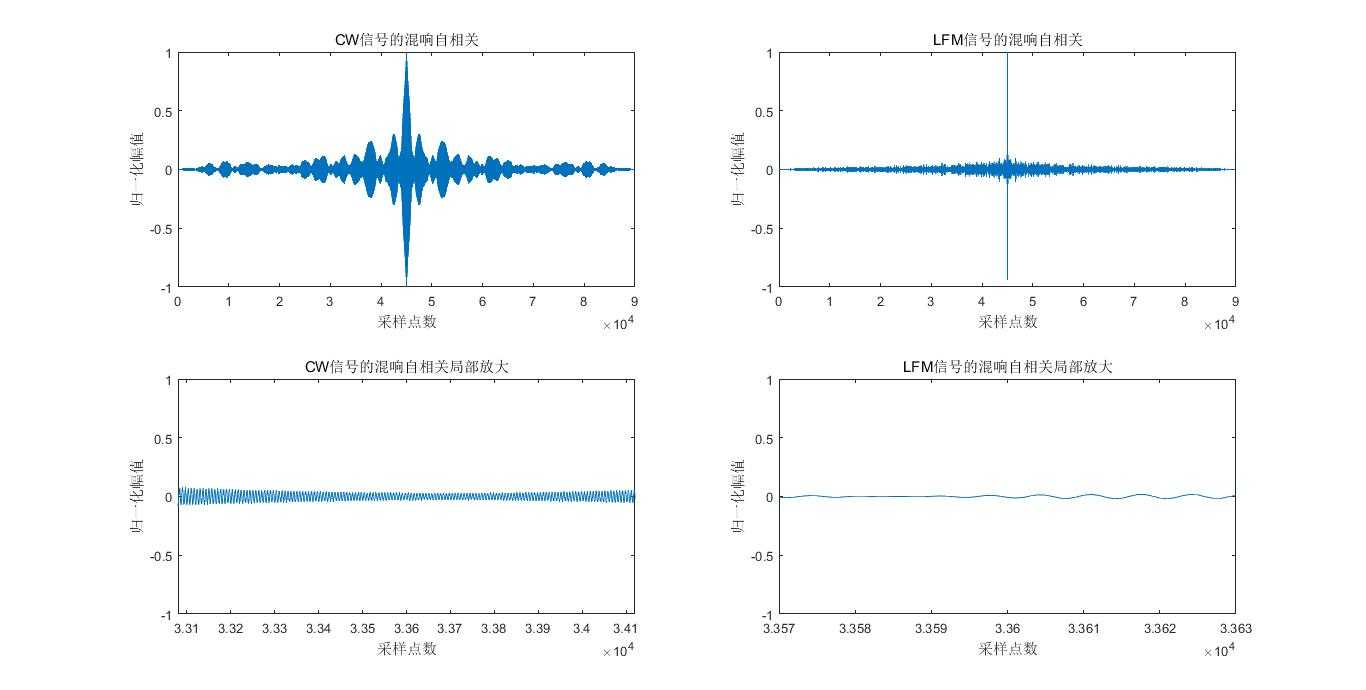
%混响时间自相关===================================================
figure(7);
subplot(2,2,1);
Rx1=xcorr(Rr1);
plot(Rx1/max(Rx1));
xlabel(‘采样点数‘);ylabel(‘归一化幅值‘);title(‘CW信号的混响自相关‘);
subplot(2,2,2);
Rx2=xcorr(Rr2);
plot(Rx2/max(Rx2));
xlabel(‘采样点数‘);ylabel(‘归一化幅值‘);title(‘LFM信号的混响自相关‘);
subplot(2,2,3);
Rx1=xcorr(Rr1);
plot(Rx1/max(Rx1));
axis([33080 34120 -1 1]); %axis([xmin xmax ymin ymax]),单轴xlim([0 5])
xlabel(‘采样点数‘);ylabel(‘归一化幅值‘);title(‘CW信号的混响自相关局部放大‘);
subplot(2,2,4);
Rx2=xcorr(Rr2);
plot(Rx2/max(Rx2));
axis([33570 33630 -1 1]); %axis([xmin xmax ymin ymax]),单轴xlim([0 5])
xlabel(‘采样点数‘);ylabel(‘归一化幅值‘);title(‘LFM信号的混响自相关局部放大‘);
%================================================================
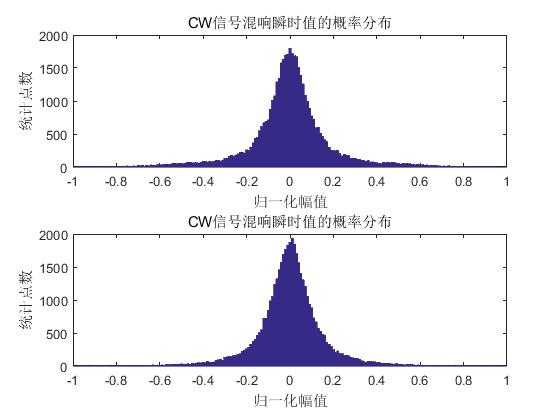
%生成混响瞬时值的概率密度,也可从工作空间的变量中直接查看
figure(8);
p=-1:0.01:1;
subplot(2,1,1);
Rr1g=Rr1/max(Rr1);
hist(Rr1g,p);
%axis([-1 1 0 1000]); %axis([xmin xmax ymin ymax])
xlim([-1 1]);xlabel(‘归一化幅值‘);ylabel(‘统计点数‘);title(‘CW信号混响瞬时值的概率分布‘);
subplot(2,1,2);
Rr2g=Rr2/max(Rr2);
hist(Rr2g,p);
%axis([-1 1 0 1000]); %axis([xmin xmax ymin ymax])
xlim([-1 1]);xlabel(‘归一化幅值‘);ylabel(‘统计点数‘);title(‘CW信号混响瞬时值的概率分布‘);
%==================================================================
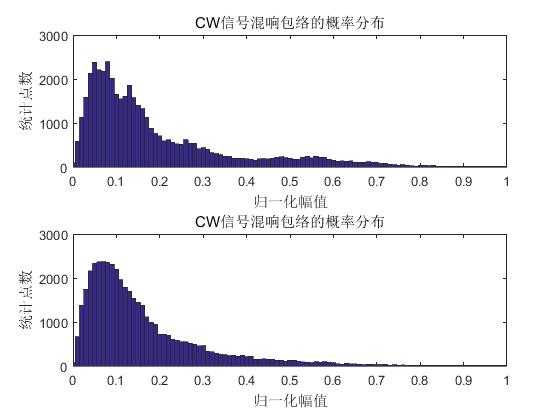
%生成混响包络的概率密度函数
figure(9);
q=0:0.01:1;
subplot(2,1,1);
hist(abs(R1)/max(abs(R1)),q);
%axis([0 1 0 1000]); %axis([xmin xmax ymin ymax])
xlim([0 1]);
xlabel(‘归一化幅值‘);ylabel(‘统计点数‘);title(‘CW信号混响包络的概率分布‘);
subplot(2,1,2);
hist(abs(R2)/max(abs(R2)),q);
%axis([0 1 0 1000]); %axis([xmin xmax ymin ymax])
xlim([0 1]);
xlabel(‘归一化幅值‘);ylabel(‘统计点数‘);title(‘CW信号混响包络的概率分布‘);
标签:模型 nbsp 增加 figure 单元 卷积 for com abs
原文地址:https://www.cnblogs.com/kiki--xiunai/p/10801026.html