标签:temp ado div nts too 容器 tchart margin char
cnpm install echarts
#在vue项目目录下安装echarts
<template>
<div class="chart-container">
<!--创建一个echarts的容器,给定高宽-->
<div id="gamechart" style="width:100%; height:100%"/>
</div>
</template>
<script>
// 安装echarts后,直接引入
import echarts from ‘echarts‘
export default {
data() {
return {
chart: null
}
},
// 挂载图表函数
mounted() {
this.initChart()
},
methods: {
initChart() {
// 将chart初始化的实例绑定到一个DOM
this.chart = echarts.init(document.getElementById(‘gamechart‘))
this.chart.setOption({
// backgroundColor: ‘rgba(57,64,86,0.02)‘,
// 标题
title: {
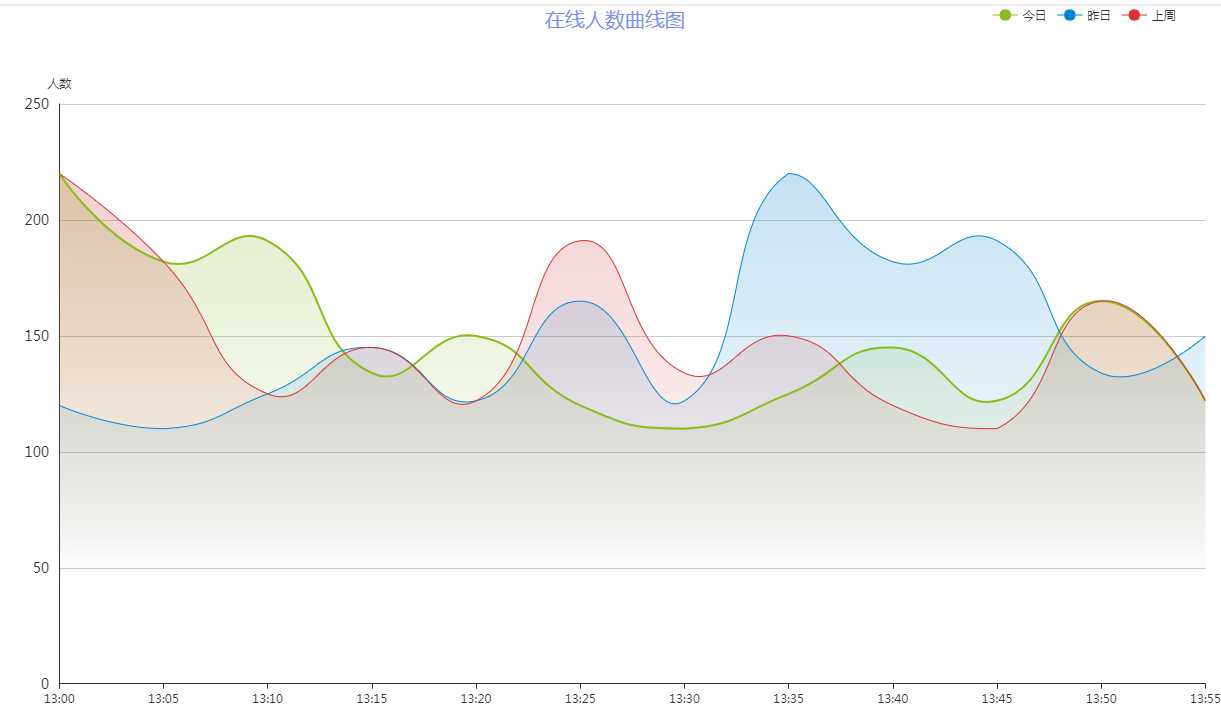
text: ‘在线人数曲线图‘,
x: ‘center‘,
textStyle: {
fontWeight: ‘normal‘,
fontSize: 20,
color: ‘#7a8ff3‘
}
},
// 鼠标悬浮提示框
tooltip: {
trigger: ‘axis‘,
},
// 图示
legend: {
data: [‘今日‘, ‘昨日‘, ‘上周‘],
right: ‘4%‘
},
// 边框栅格
grid: {
top: 100,
left: ‘2%‘,
right: ‘2%‘,
bottom: ‘2%‘,
containLabel: true
},
// X轴
xAxis: [{
type: ‘category‘,
boundaryGap: false,
data: [‘13:00‘, ‘13:05‘, ‘13:10‘, ‘13:15‘, ‘13:20‘, ‘13:25‘, ‘13:30‘, ‘13:35‘, ‘13:40‘, ‘13:45‘, ‘13:50‘, ‘13:55‘]
}],
// Y轴
yAxis: [{
type: ‘value‘,
name: ‘人数‘,
axisTick: {
show: false
},
axisLabel: {
margin: 10,
textStyle: {
fontSize: 14
}
}
}],
// 图示数据
series: [{
name: ‘今日‘,
type: ‘line‘,
smooth: true,
symbol: ‘circle‘,
symbolSize: 5,
showSymbol: false,
areaStyle: {
normal: {
color: new echarts.graphic.LinearGradient(0, 0, 0, 1, [{
offset: 0,
color: ‘rgba(137, 189, 27, 0.3)‘
}, {
offset: 0.8,
color: ‘rgba(137, 189, 27, 0)‘
}], false),
shadowColor: ‘rgba(0, 0, 0, 0.1)‘,
shadowBlur: 10
}
},
itemStyle: {
normal: {
color: ‘rgb(137,189,27)‘,
borderColor: ‘rgba(137,189,2,0.27)‘,
borderWidth: 12
}
},
data: [220, 182, 191, 134, 150, 120, 110, 125, 145, 122, 165, 122]
}, {
name: ‘昨日‘,
type: ‘line‘,
smooth: true,
symbol: ‘circle‘,
symbolSize: 5,
showSymbol: false,
lineStyle: {
normal: {
width: 1
}
},
areaStyle: {
normal: {
color: new echarts.graphic.LinearGradient(0, 0, 0, 1, [{
offset: 0,
color: ‘rgba(0, 136, 212, 0.3)‘
}, {
offset: 0.8,
color: ‘rgba(0, 136, 212, 0)‘
}], false),
shadowColor: ‘rgba(0, 0, 0, 0.1)‘,
shadowBlur: 10
}
},
itemStyle: {
normal: {
color: ‘rgb(0,136,212)‘,
borderColor: ‘rgba(0,136,212,0.2)‘,
borderWidth: 12
}
},
data: [120, 110, 125, 145, 122, 165, 122, 220, 182, 191, 134, 150]
}, {
name: ‘上周‘,
type: ‘line‘,
smooth: true,
symbol: ‘circle‘,
symbolSize: 5,
showSymbol: false,
lineStyle: {
normal: {
width: 1
}
},
areaStyle: {
normal: {
color: new echarts.graphic.LinearGradient(0, 0, 0, 1, [{
offset: 0,
color: ‘rgba(219, 50, 51, 0.3)‘
}, {
offset: 0.8,
color: ‘rgba(219, 50, 51, 0)‘
}], false),
shadowColor: ‘rgba(0, 0, 0, 0.1)‘,
shadowBlur: 10
}
},
itemStyle: {
normal: {
color: ‘rgb(219,50,51)‘,
borderColor: ‘rgba(219,50,51,0.2)‘,
borderWidth: 12
}
},
data: [220, 182, 125, 145, 122, 191, 134, 150, 120, 110, 165, 122]
}]
})
}
}
}
</script>
<style scoped>
.chart-container{
position: relative;
width: 100%;
height: calc(100vh - 84px);
}
</style>
标签:temp ado div nts too 容器 tchart margin char
原文地址:https://www.cnblogs.com/jabbok/p/10821304.html