标签:sqrt frame dom test 集成 span int jpg 转化
--数据来源kaggle比赛
本文仅就学习的机器学习算法进行简单的实践。
一、问题及数据导入
显然,目的肯定是根据现有的数据,来对房价进行预测了,本数据变量较多,这里不再一一叙述,官网下载的数据又对变量进行描述。
首先导入基本的库
1 import numpy as np
2 import pandas as pd
接下来导入数据
1 train=pd.read_csv(‘train.csv‘)
2 test=pd.read_csv(‘test.csv‘)
简单的查看下数据
1 train.shape
2 test.shape
1 (1460, 81)
2 (1459, 80)
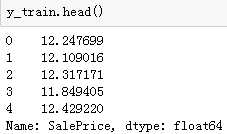
然后,我们先给出y_train的值,这里进行对数处理,是为了防止原始数据不够平滑。
y_train=np.log1p(train.pop(‘SalePrice‘))
为了方便后续分析,我们合并训练和测试样本
1 #数据合并
2 all_date = pd.concat((train, test), axis=0)
3 all_date.shape
二、变量转化及处理
对数据采用get_dummy进行one-hot处理
1 all_date = pd.get_dummies(all_date, dummy_na=True)
2 all_date.shape
1 (2919, 332)
我们可以看到,经过上述处理,特征数一下变为332了
查看数据的缺失情况:
all_date.isnull().sum().sort_values(ascending=False).head(10)
PoolQC          2909
MiscFeature     2814
Alley           2721
Fence           2348
FireplaceQu     1420
LotFrontage      486
GarageCond       159
GarageQual       159
GarageYrBlt      159
GarageFinish     159
dtype: int64
这里,我们对数据进行标准化,然后对缺失值进行填充
这一步并不是必要,一般来说,对于回归分类器,最好是把源数据给放在一个标准分布内。不要让数据间的差距太大。
1 num_date = all_date.dtypes[all_date.dtypes != ‘object‘].index
2 all_date[num_date] = all_date[num_date].apply(
3 lambda x: (x - x.mean()) / (x.std()))
4 # 标准化后,每个特征的均值变为0,所以可以直接?0来替换缺失值
5 all_date[num_date] = all_date[num_date].fillna(0)
再看看缺失值是否填充完整:
all_date.isnull().sum().sum()
0
缺失值填充完毕
三、模型建立
首先把训练集和测试集分离
dummy_train = all_date.iloc[train.index]
dummy_test = all_date.iloc[test.index]
dummy_train.shape,dummy_test.shape
((1460, 332), (1459, 332))
模块导入
from sklearn.linear_model import Ridge
from sklearn.model_selection import cross_val_score
x_train = dummy_train.values
x_test = dummy_test.values
采用交叉验证测试模型:
1 alphas = np.logspace(-2,9,30,base=2)
2 test_scores = []
3 for alpha in alphas:
4     clf = Ridge(alpha)
5     test_score =np.sqrt(-cross_val_score(clf, x_train, y_train, cv=10, scoring=‘neg_mean_squared_error‘))
6     test_scores.append(np.mean(test_score))
import matplotlib.pyplot as plt
%matplotlib inline
plt.plot(alphas, test_scores)
plt.savefig(‘A-E.jpg‘)
plt.title("Alpha - Error");
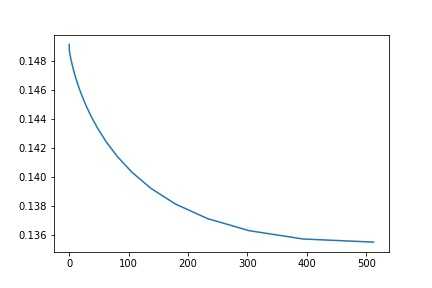
这里,我们看到alpha=450左右的时候,效果最后,大约0.135左右
然后,我们再跑一跑随机森林试试。
1 #随机森林
2 from sklearn.ensemble import RandomForestRegressor
3 max_features = [.1,.28, .32, .45, .67, .79, .85,.99]
4 test_scores = []
5 for max_feat in max_features:
6     clf = RandomForestRegressor(n_estimators=200, max_features=max_feat)
7     test_score = np.sqrt(-cross_val_score(clf, x_train, y_train, cv=5, scoring=‘neg_mean_squared_error‘))
8     test_scores.append(np.mean(test_score))
1 plt.plot(max_features, test_scores)
2 plt.savefig(‘A-E.jpg‘)
3 plt.title("Features - Error");
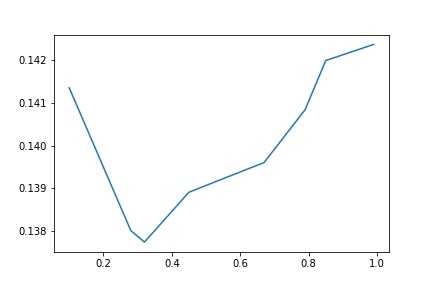
这里我们看到,当max_feature=0.3左右的时候,最优值略低于0.138
然后,我们将两个模型融合,去平均值,给出预测值。
1 #模型融合
2 ridge = Ridge(alpha=450)
3 rf = RandomForestRegressor(n_estimators=300, max_features=.28)
1 ridge.fit(x_train, y_train)
2 rf.fit(x_train, y_train)
以上均是选取调参后给出的最优参数。
#预测的值是对数化的,这里要进行还原
y_ridge = np.expm1(ridge.predict(x_test))
y_rf = np.expm1(rf.predict(x_test))
#取平均值
y_final = (y_ridge + y_rf) / 2
submission_df = pd.DataFrame(data= {‘Id‘ : test[‘Id‘], ‘SalePrice‘: y_final})
submission_df.head(10)
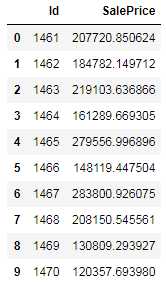
然后,我们调出官方给出的数据对比下
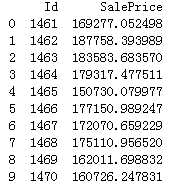
似乎,效果还行。
接下来,我们采用集成学习,对模型进行改进,试试集成学习的效果。
说明下,前面的数据处理,这里没有作改动。
1 from sklearn.ensemble import BaggingRegressor
2 from sklearn.model_selection import cross_val_score
3 from sklearn.linear_model import Ridge
4 ridge = Ridge(450)
1 params = [ 5, 10, 16, 24, 32, 40,45,50]
2 test_scores = []
3 for param in params:
4     clf = BaggingRegressor(n_estimators=param, base_estimator=ridge)
5     test_score = np.sqrt(-cross_val_score(clf, x_train, y_train, cv=10, scoring=‘neg_mean_squared_error‘))
6     test_scores.append(np.mean(test_score))
1 import matplotlib.pyplot as plt
2 %matplotlib inline
3 plt.plot(params, test_scores)
4 plt.savefig(‘bag.jpg‘)
5 plt.title("n_estimator - Error");
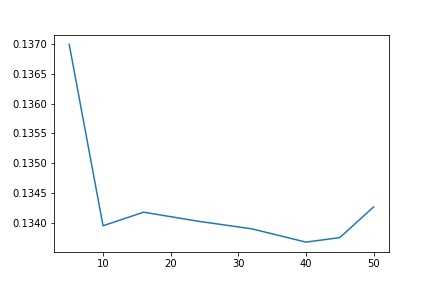
前面,我们单纯采用ridge模型,最优的模型约为0.135,现在采用40个ridge分类器,误差可以降到0.133左右。
接下来,采用 boosting试一试,理论上,boosting比bagging稍微好一点。
1 from sklearn.ensemble import AdaBoostRegressor
2 params = [ 5, 10, 16, 24, 32, 40,45,50]3 test_scores = []
4 for param in params:
5     clf = BaggingRegressor(n_estimators=param, base_estimator=ridge)
6     test_score = np.sqrt(-cross_val_score(clf, x_train, y_train, cv=10, scoring=‘neg_mean_squared_error‘))
7     test_scores.append(np.mean(test_score))
1 plt.plot(params, test_scores)
2 plt.savefig(‘boos.jpg‘)
3 plt.title("n_estimator - Error");
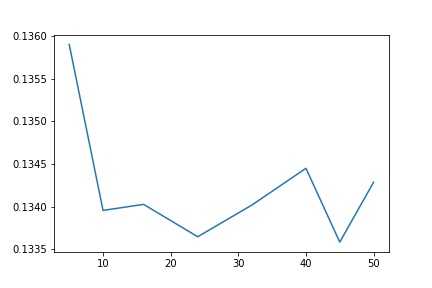
似乎与boosting差不多。0.1336的误差
最后,我们采用xgboost试一试,这个似乎是kaggle的绝招。同等数据下,误差会更滴。
from xgboost import XGBRegressor
params = [1,2,3,4,5,6,7,8,9]
test_scores = []
for param in params:
    clf = XGBRegressor(max_depth=param)
    test_score = np.sqrt(-cross_val_score(clf, x_train, y_train, cv=10, scoring=‘neg_mean_squared_error‘))
    test_scores.append(np.mean(test_score))
1 import matplotlib.pyplot as plt
2 %matplotlib inline
3 plt.plot(params, test_scores)
4 plt.savefig(‘xg.jpg‘)
5 plt.title("max_depth-Error");
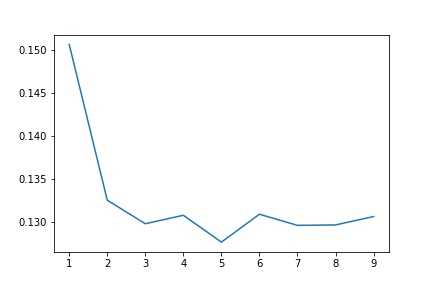
此时,当深度为5时,错误率下降到了0.128左右。确实很不错。
标签:sqrt frame dom test 集成 span int jpg 转化
原文地址:https://www.cnblogs.com/iforger/p/10840574.html