标签:需要 ace sim .sh some 取图 randn 注意 简单
目录
import numpy as np
import matplotlib.pyplot as plt在开始教程之前,我们必须先了解matplotlib.pyplot.legend(),该函数可以用以添加图例。
通过这种方式,lendgend()会从artist中获取label属性,并自动生成图例,比如:
fig, ax = plt.subplots()
line, = ax.plot([1, 2, 3], label="Inline label")
ax.legend()
plt.show()
或者:
line.set_label("Inline label")
ax.legend()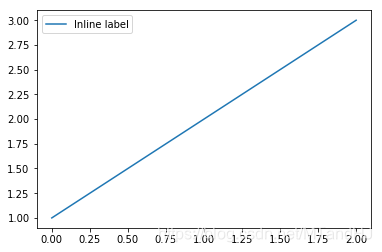
我们也可以通过下列操作,为已经存在的Artist添加图例,但是这种方式并不推荐,因为我们很容易混淆。
fig, ax = plt.subplots()
line, = ax.plot([1, 2, 3])
ax.legend(["A simple line"])
我们也可以显示添加图例:
fig, ax = plt.subplots()
line1, = ax.plot([1, 2, 3])
line2, = ax.plot([3, 2, 1])
ax.legend((line1, line2), ("line1", "line2"))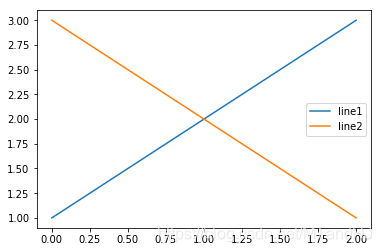
参数:
handle: Artist
label: 标签
loc:位置,比如"best":0, "upper right" 1 ...
fontsize
...
直接使用legend()命令,matplotlib会自动检测并生成图例,这种方式等价于:
handles, labels = ax.get_legend_handles_labels()
ax.legend(handles, labels)
需要注意的是,只有为Artist设置标签了,通过get_legend_handles_labels()才有效。
有些时候,我们只需要为部分Artist设置图例,这时只需手动传入handles:
line_up, = plt.plot([1,2,3], label='Line 2')
line_down, = plt.plot([3,2,1], label='Line 1')
plt.legend(handles=[line_up, line_down])
当然了,相应的可以传入标签:
line_up, = plt.plot([1,2,3], label='Line 2')
line_down, = plt.plot([3,2,1], label='Line 1')
plt.legend([line_up, line_down], ['Line Up', 'Line Down'])并不是所有的Artist都能被自动设置为图例,也不是所有Artist都需要被设置为图例。
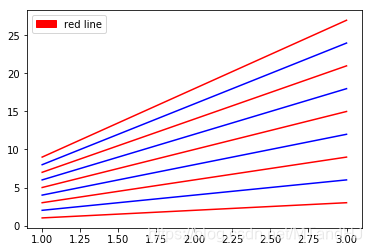
假如我们想要为所有红颜色的玩意儿设置图例:
import matplotlib.patches as mpatches

x = np.arange(1, 4)
fig, ax = plt.subplots()
for i in range(1, 10):
    ax.plot(x, i * x, color = "red" if i % 2 else "blue")

red_patch = mpatches.Patch(color="red")
# red_patch: <matplotlib.patches.Patch object at 0x00000228D0D4BF60>
plt.legend(handles=[red_patch], labels=["red line"])
plt.show()
如果没理解错,通过patches.Patch构造了一个颜色为红色的Artist类,然后legend()就会对所有满足条件的Artist的类进行处理(其实也用不了处理啊,只是加了图例)。错啦错啦,实际上,就是简单地造了一个颜色为红色的片,价格red line标签而已,跟已有的Artist没啥关系。
实际上,图例并不十分依赖于现有的Artist,我们完全可以随心所欲地添加:
import matplotlib.lines as mlines
blue_line = mlines.Line2D([], [], color='blue', marker='*',
                          markersize=15, label='Blue stars')
plt.legend(handles=[blue_line])

plt.show()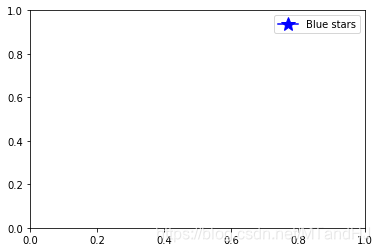
legend()提供了loc参数,可以处理一般的位置。而bbox_to_anchor参数可以更加有效强大地来定位:
x = np.arange(1, 4)
fig, ax = plt.subplots()
for i in range(1, 10):
    ax.plot(x, i * x, color = "red" if i % 2 else "blue", label="line{0}".format(i))

plt.legend(bbox_to_anchor=(1, 1),
           bbox_transform=plt.gcf().transFigure)
plt.show()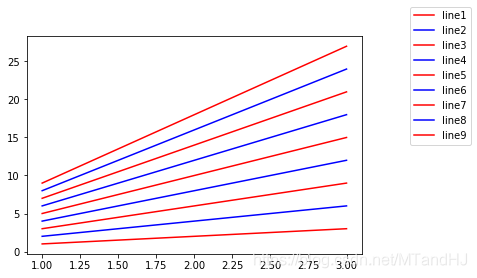
bbox_to_anchor=(1,1)表示legend的位置在右上角,因为bbox_transform,我们将坐标转换为了当前figure的坐标系,也就是图例会放在整个图片的右上角,如果我们去掉这个选项:
plt.legend(bbox_to_anchor=(1, 1))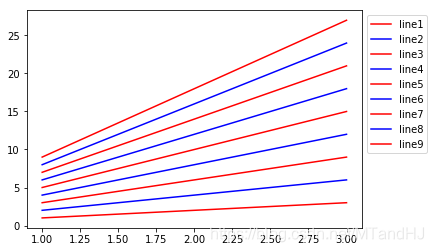
这个时候和下面是等价的:
plt.legend(bbox_to_anchor=(1,1),
        bbox_transform=ax.transAxes)
即,此时的(1,1)表示的是Axes的右上角。
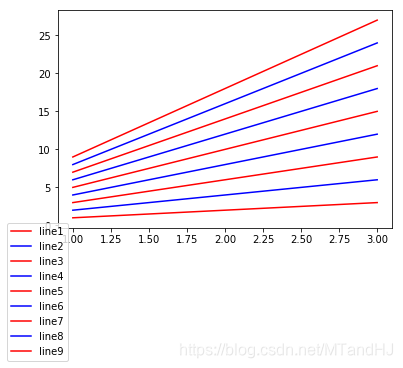
当我们这么做的时候:
plt.legend(bbox_to_anchor=(1, 1),
           bbox_transform=ax.transData)
这个时候以数据,也就是我们看到的坐标为依据:
下面会用到的一些参数分析:
bbox_to_anchor: (x, y, width, height) 说实话,我并没有搞懂width, height的含义,有的时候能调正宽度,有的时候又不能
ncol: 图例的列数,有些时候图例太多,让他分成俩列三列啊
boderraxespad: axes与图例边界的距离。
plt.subplot(211)
plt.plot([1, 2, 3], label="test1")
plt.plot([3, 2, 1], label="test2")

# Place a legend above this subplot, expanding itself to
# fully use the given bounding box.
plt.legend(bbox_to_anchor=(0., 1.02, 1., .102), loc='lower left',
           ncol=2, mode="expand", borderaxespad=0.)

plt.subplot(223)
plt.plot([1, 2, 3], label="test1")
plt.plot([3, 2, 1], label="test2")
# Place a legend to the right of this smaller subplot.
plt.legend(bbox_to_anchor=(1.05, 1), loc='upper left', borderaxespad=1.)

plt.show()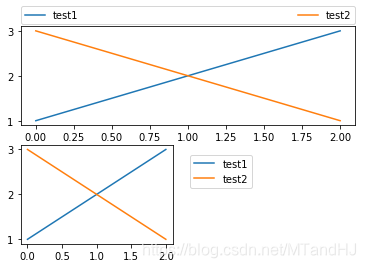
如果我们多次使用legend(),实际上并不会生成多个图例:
fig, ax = plt.subplots()
line1, = ax.plot([1, 2, 3])
line2, = ax.plot([3, 2, 1])
ax.legend([line1], ["line1"])
ax.legend([line2], ["line2"])

plt.show()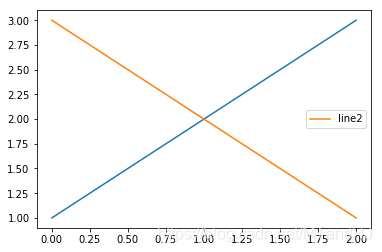
为此,我们需要手动添加图例:
fig, ax = plt.subplots()
line1, = ax.plot([1, 2, 3])
line2, = ax.plot([3, 2, 1])
legend1 = ax.legend([line1], ["line1"], loc="upper right")
ax.add_artist(legend1)
ax.legend([line2], ["line2"])

plt.show()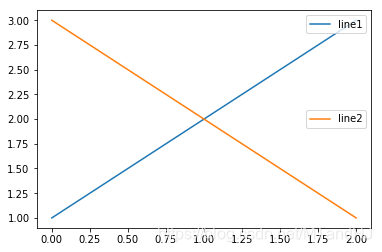
没看懂啥意思。
from matplotlib.legend_handler import HandlerLine2D

line1, = plt.plot([3, 2, 1], marker='o', label='Line 1')
line2, = plt.plot([1, 2, 3], marker='o', label='Line 2')

plt.legend(handler_map={line1: HandlerLine2D(numpoints=4)})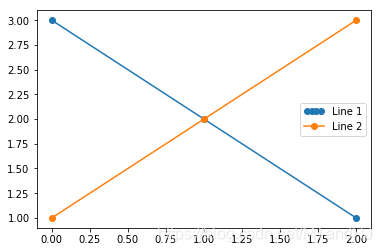
from numpy.random import randn

z = randn(10)

red_dot, = plt.plot(z, "ro", markersize=15)
# Put a white cross over some of the data.
white_cross, = plt.plot(z[:5], "w+", markeredgewidth=3, markersize=15)

plt.legend([red_dot, (red_dot, white_cross)], ["Attr A", "Attr A+B"])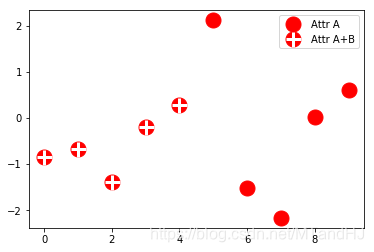
从这例子中感觉,就是legend_handler里面有一些现成,稀奇古怪的图例供我们使用?
from matplotlib.legend_handler import HandlerLine2D, HandlerTuple

p1, = plt.plot([1, 2.5, 3], 'r-d')
p2, = plt.plot([3, 2, 1], 'k-o')

l = plt.legend([(p1, p2)], ['Two keys'], numpoints=1,
               handler_map={tuple: HandlerTuple(ndivide=None)})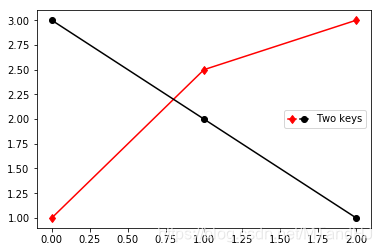
这一节呢,主要就是告诉我们,如何通过handler_map这个参数,传入一个映射,可以构造任意?奇形怪状的图例?不过参数也忒多了吧,不过感觉蛮有用的。
import matplotlib.patches as mpatches


class AnyObject(object):
    pass


class AnyObjectHandler(object):
    def legend_artist(self, legend, orig_handle, fontsize, handlebox):
        x0, y0 = handlebox.xdescent, handlebox.ydescent
        width, height = handlebox.width, handlebox.height
        patch = mpatches.Rectangle([x0, y0], width, height, facecolor='red',
                                   edgecolor='black', hatch='xx', lw=3,
                                   transform=handlebox.get_transform())
        handlebox.add_artist(patch)
        return patch


plt.legend([AnyObject()], ['My first handler'],
           handler_map={AnyObject: AnyObjectHandler()})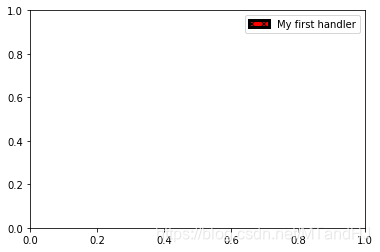
from matplotlib.legend_handler import HandlerPatch


class HandlerEllipse(HandlerPatch):
    def create_artists(self, legend, orig_handle,
                       xdescent, ydescent, width, height, fontsize, trans):
        center = 0.5 * width - 0.5 * xdescent, 0.5 * height - 0.5 * ydescent
        p = mpatches.Ellipse(xy=center, width=width + xdescent,
                             height=height + ydescent)
        self.update_prop(p, orig_handle, legend)
        p.set_transform(trans)
        return [p]


c = mpatches.Circle((0.5, 0.5), 0.25, facecolor="green",
                    edgecolor="red", linewidth=3)
plt.gca().add_patch(c)

plt.legend([c], ["An ellipse, not a rectangle"],
           handler_map={mpatches.Circle: HandlerEllipse()})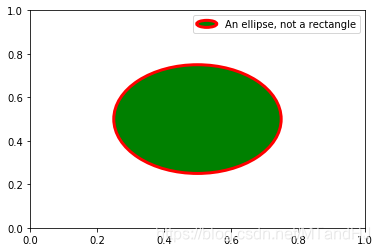
"""都是啥和啥啊。。。"""
class AnyObject(object):
    pass


class AnyObjectHandler(object):
    def legend_artist(self, legend, orig_handle, fontsize, handlebox):
        x0, y0 = handlebox.xdescent, handlebox.ydescent
        width, height = handlebox.width, handlebox.height
        patch = mlines.Line2D([1, 2, 3, 4, 6], [1, 2, 3, 4, 6], linewidth=width/2, color='red',
                                   transform=handlebox.get_transform())
        handlebox.add_artist(patch)
        return patch


plt.legend([AnyObject()], ['My first handler'],
           handler_map={AnyObject: AnyObjectHandler()})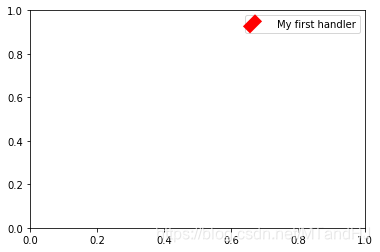
plt.lengend()-添加图例
get_legend_handles_labels()-获取图例处理对象和对应的标签
matplotlib.patches-包括向量,圆,矩形,多边形等等
legend_artist
标签:需要 ace sim .sh some 取图 randn 注意 简单
原文地址:https://www.cnblogs.com/MTandHJ/p/10850415.html