标签:http color os ar for sp 数据 2014 ad
lm函数,可以用一种线程关系建立两个数据之间的发展趋势,也就是线程拟合,并用predict函数将这种发展趋势的结果用于数据的预测。
fr = lm(Height~Weight,data=hw)
coef(fr)

建立基于Weight来预测Height的线程拟合。由截距和斜率定义的一条直线。可视化如下图示:
library("ggplot2")
ggplot(heights.weights,aes(x=Height,y=Weight)) + geom_point()+geom_smooth(method="lm")
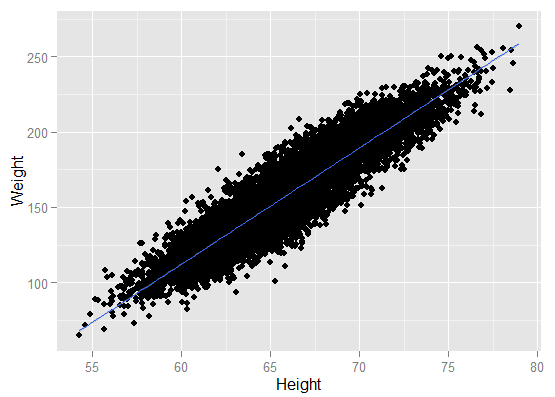
这是一种很理想的情况。
那我们看一下预测。
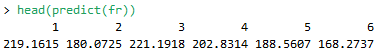
predict函数是在原模型的基础上,依据线性拟合模型的结果对所有的Height,应用Weight得到一个预测的Height。
predict(fr)
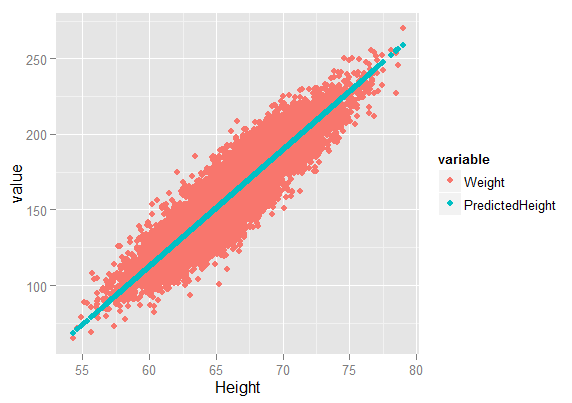
嗯,让我们把预测的数和真实的数放到一起。
heights.weights = transform(heights.weights,PredictedHeight = predict(fr))
hw = melt(heights.weights, id.vars = c(‘Gender‘, ‘Height‘))
ggplot(hw,aes(x=Height,y=value,color=variable)) + geom_point()
图形化的结果和我们之前看到的图是一样的。预测的值就是延着直线前进的。
标签:http color os ar for sp 数据 2014 ad
原文地址:http://my.oschina.net/piorcn/blog/335854