标签:style blog http color io os ar for strong

.png)

.png)


__author__ = ‘xianweizheng‘
from numpy import *
import matplotlib.pyplot  as plt
import operator
def createDataSet():
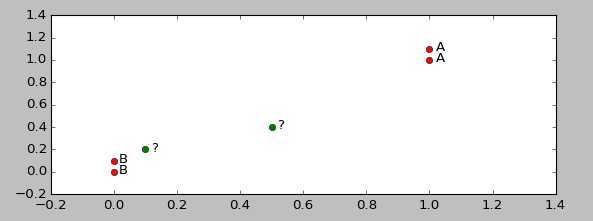
    group = array([[1.0,1.1],[1.0,1.0],[0,0],[0,0.1]])
    labels = [‘A‘,‘A‘,‘B‘,‘B‘]
    return group, labels

def dataSetPlot(group, labels):
    x = [] ; y = [] ;len =group.__len__()
    for i in arange(0,len):
        x.append([group[i][0]])
        y.append([group[i][1]])
        plt.text(group[i][0]+0.02,group[i][1]-0.02,labels[i])
    return x,y


def kNNClassify(inX, dataSet, labels, k):
    ‘‘‘classify using kNN

    step 1: calculate Euclidean distance
    step 2: sort the distance
    step 3: choose the min k distance
    step 4: count the times labels occur
    step 5: the max voted class will return ‘‘‘

    ## step 1: calculate Euclidean distance
    dataSetSize = dataSet.shape[0]  #dataSet.shape() 为 (4,2)表示4行两列
    diffMat = tile(inX, (dataSetSize,1)) - dataSet  #tile(a,(n1,n2)) n2表示列重复能n2次,n1表示行重复n1次
    sqDiffMat = diffMat**2
    sqDistances = sqDiffMat.sum(axis=1)   #diffMat 行相加  构成一个新的list
    distances = array(sqDistances**0.5)

    ## step 2: sort the distance
    # argsort 标注出一个序列y,这个序列式是  排序后的数,在未排序数组x中出现的位置
    sortedDistIndicies = distances.argsort()
    classCount={}  # define a dictionary (can be append element)

     ## step 3: choose the min k distance
    for i in arange(k):
        voteIlabel = labels[sortedDistIndicies[i]]

        ## step 4: count the times labels occur
        classCount[voteIlabel] = classCount.get(voteIlabel,0)+1

    ## step 5: the max voted class will return
    maxCount = 0
    for key, value in classCount.items():
        if value > maxCount:
            maxCount = value
            maxIndex = key
    return maxIndex

def display(inX,outputLabel):
     print("Your input is:", inX, " and classified to class: ", outputLabel )

def testKnnSimple():
    group, labels = createDataSet()
    k=3
    input = array([[0.5,0.4],[0.1,0.2]])
    unknowLabels =[]
    outputLabels =[]
    for i in arange(input.__len__()):
        unknowLabels.append(‘?‘)
        outputLabel = kNNClassify(input[i], group, labels, k)
        display(input[i],outputLabel)
        outputLabels.append(outputLabel)
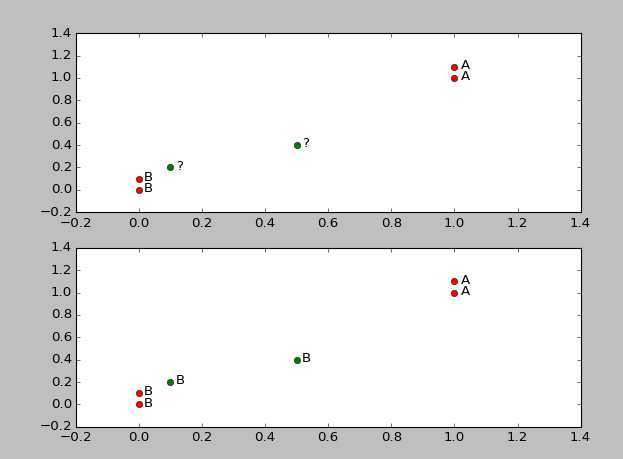
    plt.figure("Data plot")
    plt.subplot(211)
    plt.xlim(-0.2,1.4);plt.ylim(-0.2,1.4)
    x,y = dataSetPlot(group,labels)
    plt.plot(x,y,‘ro‘)
    x,y = dataSetPlot(input, unknowLabels)
    plt.plot(x,y,‘go‘)

    plt.subplot(212)
    plt.xlim(-0.2,1.4);plt.ylim(-0.2,1.4)
    x,y = dataSetPlot(group,labels)
    plt.plot(x,y,‘ro‘)
    x,y = dataSetPlot(input, outputLabels)
    plt.plot(x,y,‘go‘)
    plt.show()

testKnnSimple()
运行结果:


标签:style blog http color io os ar for strong
原文地址:http://www.cnblogs.com/qianwen/p/4041439.html