标签:线图 += add 颜色 html col fine 折线图 val
图表间之间的组件间隔:body-->属性-->布局-->组件间隔
决策报表背景水印:body-->属性-->水印
仪表盘指针/枢纽/背景颜色:样式-->系列
柱形图/组合图警戒线:样式-->背景-->绘图区-->警戒线Y轴
折线图间隔背景:样式-->背景-->绘图区-->间隔背景
柱形图圆角:样式-->系列-->边框-->圆角
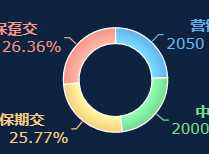
环形饼图,将饼图设置为下图环形样式 : 样式-->系列-->样式-->内经占比
饼图展示的数据不需要分类,系列名使用字段值即可

组合地图~系列名和值保持居中:
自定义JavaScript代码,使用HTML解析
function(){
var name = this.name;
var total = ‘<div style="width:100%;height:200%;">‘;
total += ‘<div align=center style="vertical-align:top;padding-bottom:1px;"> <span style="font-size:10px;color:‘+name+‘">‘+FR.contentFormat(this.name, ‘‘)+‘</span><br><span style="font-size:10px;">‘+
FR.contentFormat(this.value, ‘#,##0‘)+‘</span></div>‘;
total+=‘</div>‘;
return total; }

跨报表块取值:report0(报表快)~D10(单元格)
标签:线图 += add 颜色 html col fine 折线图 val
原文地址:https://www.cnblogs.com/Williamls/p/10841307.html