标签:style blog http color io os ar for sp
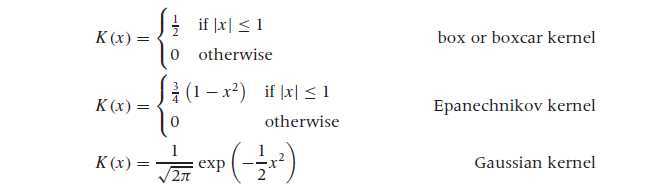
核函数估计
Demo I
import sys,re,os
import numpy as np
from scipy import stats
import matplotlib.pylab as plt

if __name__ == ‘__main__‘:
    # random data
    grade = [np.random.rand(100) * 100]
    fig = plt.figure()

    # KDE
    ax1 = fig.add_subplot(211)
    ind = np.arange(0.,100.,1)
    gkde = stats.kde.gaussian_kde(grade, bw_method = ‘scott‘)
    ax1.plot(ind, gkde(ind), label=‘Gods\‘ Grade‘, color="g")
    ax1.set_title(‘Kernel Density Estimation‘)
    ax1.legend()

    # hisogram
    ax2 = fig.add_subplot(212)
    ax2.hist(grade, 100, range = (0,100), normed = True)

    plt.show()
Demo II
scikit-learn中的demo
http://scikit-learn.org/stable/auto_examples/neighbors/plot_kde_1d.html
# -*- coding: utf-8 -*-
"""
Created on Wed Oct 22 20:38:13 2014

@author: dell
"""

# Author: Jake Vanderplas <jakevdp@cs.washington.edu>
#
import numpy as np
import matplotlib.pyplot as plt
from scipy.stats import norm
from sklearn.neighbors import KernelDensity


#----------------------------------------------------------------------
# Plot the progression of histograms to kernels
np.random.seed(1)
N = 20
X = np.concatenate((np.random.normal(0, 1, 0.3 * N),
                    np.random.normal(5, 1, 0.7 * N)))[:, np.newaxis]
X_plot = np.linspace(-5, 10, 1000)[:, np.newaxis]
bins = np.linspace(-5, 10, 10)

fig, ax = plt.subplots(2, 2, sharex=True, sharey=True)
fig.subplots_adjust(hspace=0.05, wspace=0.05)

# histogram 1
ax[0, 0].hist(X[:, 0], bins=bins, fc=‘#AAAAFF‘, normed=True)
ax[0, 0].text(-3.5, 0.31, "Histogram")

# histogram 2
ax[0, 1].hist(X[:, 0], bins=bins + 0.75, fc=‘#AAAAFF‘, normed=True)
ax[0, 1].text(-3.5, 0.31, "Histogram, bins shifted")

# tophat KDE
kde = KernelDensity(kernel=‘tophat‘, bandwidth=0.75).fit(X)
log_dens = kde.score_samples(X_plot)
ax[1, 0].fill(X_plot[:, 0], np.exp(log_dens), fc=‘#AAAAFF‘)
ax[1, 0].text(-3.5, 0.31, "Tophat Kernel Density")

# Gaussian KDE
kde = KernelDensity(kernel=‘gaussian‘, bandwidth=0.75).fit(X)
log_dens = kde.score_samples(X_plot)
ax[1, 1].fill(X_plot[:, 0], np.exp(log_dens), fc=‘#AAAAFF‘)
ax[1, 1].text(-3.5, 0.31, "Gaussian Kernel Density")

for axi in ax.ravel():
    axi.plot(X[:, 0], np.zeros(X.shape[0]) - 0.01, ‘+k‘)
    axi.set_xlim(-4, 9)
    axi.set_ylim(-0.02, 0.34)

for axi in ax[:, 0]:
    axi.set_ylabel(‘Normalized Density‘)

for axi in ax[1, :]:
    axi.set_xlabel(‘x‘)

#----------------------------------------------------------------------
# Plot all available kernels
X_plot = np.linspace(-6, 6, 1000)[:, None]
X_src = np.zeros((1, 1))

fig, ax = plt.subplots(2, 3, sharex=True, sharey=True)
fig.subplots_adjust(left=0.05, right=0.95, hspace=0.05, wspace=0.05)


def format_func(x, loc):
    if x == 0:
        return ‘0‘
    elif x == 1:
        return ‘h‘
    elif x == -1:
        return ‘-h‘
    else:
        return ‘%ih‘ % x

for i, kernel in enumerate([‘gaussian‘, ‘tophat‘, ‘epanechnikov‘,
                            ‘exponential‘, ‘linear‘, ‘cosine‘]):
    axi = ax.ravel()[i]
    log_dens = KernelDensity(kernel=kernel).fit(X_src).score_samples(X_plot)
    axi.fill(X_plot[:, 0], np.exp(log_dens), ‘-k‘, fc=‘#AAAAFF‘)
    axi.text(-2.6, 0.95, kernel)

    axi.xaxis.set_major_formatter(plt.FuncFormatter(format_func))
    axi.xaxis.set_major_locator(plt.MultipleLocator(1))
    axi.yaxis.set_major_locator(plt.NullLocator())

    axi.set_ylim(0, 1.05)
    axi.set_xlim(-2.9, 2.9)

ax[0, 1].set_title(‘Available Kernels‘)

#----------------------------------------------------------------------
# Plot a 1D density example
N = 100
np.random.seed(1)
X = np.concatenate((np.random.normal(0, 1, 0.3 * N),
                    np.random.normal(5, 1, 0.7 * N)))[:, np.newaxis]

X_plot = np.linspace(-5, 10, 1000)[:, np.newaxis]

true_dens = (0.3 * norm(0, 1).pdf(X_plot[:, 0])
             + 0.7 * norm(5, 1).pdf(X_plot[:, 0]))

fig, ax = plt.subplots()
ax.fill(X_plot[:, 0], true_dens, fc=‘black‘, alpha=0.2,
        label=‘input distribution‘)

for kernel in [‘gaussian‘, ‘tophat‘, ‘epanechnikov‘]:
    kde = KernelDensity(kernel=kernel, bandwidth=0.5).fit(X)
    log_dens = kde.score_samples(X_plot)
    ax.plot(X_plot[:, 0], np.exp(log_dens), ‘-‘,
            label="kernel = ‘{0}‘".format(kernel))

ax.text(6, 0.38, "N={0} points".format(N))

ax.legend(loc=‘upper left‘)
ax.plot(X[:, 0], -0.005 - 0.01 * np.random.random(X.shape[0]), ‘+k‘)

ax.set_xlim(-4, 9)
ax.set_ylim(-0.02, 0.4)
plt.show()
PIC2, Kernel Density Estimates
标签:style blog http color io os ar for sp
原文地址:http://www.cnblogs.com/hluo/p/4044241.html